Data Protection Contracts in London

Data Protection
England > London

The table below provides summary statistics for contract job vacancies advertised in London requiring Data Protection skills. It includes a benchmarking guide to the contractor rates offered in vacancies that cited Data Protection over the 6 months leading up to 1 July 2025, comparing them to the same period in the previous two years.

6 months to
1 Jul 2025
Same period 2024 Same period 2023
Rank 93 96 106
Rank change year-on-year +3 +10 +10
Contract jobs citing Data Protection 368 450 618
As % of all contract jobs advertised in London 2.85% 2.58% 2.44%
As % of the Processes & Methodologies category 3.09% 2.91% 2.69%
Number of daily rates quoted 170 261 398
10th Percentile £257 £250 £400
25th Percentile £361 £413 £475
Median daily rate (50th Percentile) £500 £525 £600
Median % change year-on-year -4.76% -12.50% -
75th Percentile £638 £638 £745
90th Percentile £738 £775 £825
England median daily rate £485 £500 £538
% change year-on-year -3.00% -6.98% -2.27%
Number of hourly rates quoted 7 13 3
10th Percentile £26.15 - £43.08
25th Percentile £26.88 £11.95 £46.15
Median hourly rate £30.81 £24.50 £52.50
Median % change year-on-year +25.73% -53.33% +31.25%
75th Percentile £34.94 £62.50 £65.00
90th Percentile £36.69 £70.00 £71.75
England median hourly rate £28.32 £19.50 £31.50
% change year-on-year +45.23% -38.10% +40.00%

All Process and Methodology Skills
London

Data Protection falls under the Processes and Methodologies category. For comparison with the information above, the following table provides summary statistics for all contract job vacancies requiring process or methodology skills in London.

Contract vacancies with a requirement for process or methodology skills 11,891 15,474 22,954
As % of all contract IT jobs advertised in London 92.21% 88.55% 90.74%
Number of daily rates quoted 7,950 11,028 16,622
10th Percentile £333 £343 £372
25th Percentile £425 £446 £471
Median daily rate (50th Percentile) £550 £550 £587
Median % change year-on-year - -6.34% +2.13%
75th Percentile £675 £686 £700
90th Percentile £799 £800 £800
England median daily rate £515 £525 £550
% change year-on-year -1.90% -4.55% -
Number of hourly rates quoted 220 303 260
10th Percentile £16.50 £15.59 £18.50
25th Percentile £24.66 £20.01 £23.00
Median hourly rate £32.00 £30.00 £40.25
Median % change year-on-year +6.67% -25.47% +11.17%
75th Percentile £50.13 £48.75 £65.00
90th Percentile £63.30 £68.60 £82.50
England median hourly rate £25.15 £38.12 £37.50
% change year-on-year -34.02% +1.65% +46.03%

Data Protection
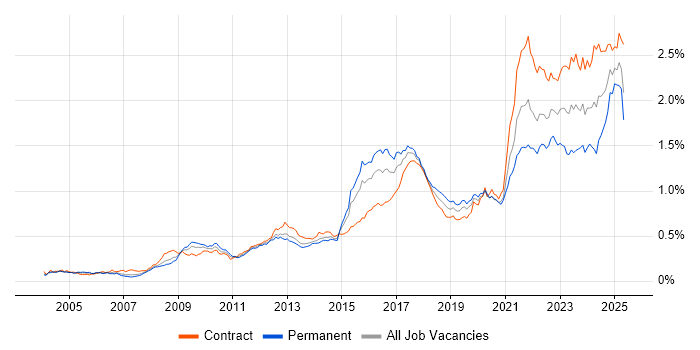
Job Vacancy Trend in London

Job postings citing Data Protection as a proportion of all IT jobs advertised in London.

Job vacancy trend for Data Protection in London

Data Protection
Contractor Daily Rate Trend in London

3-month moving average daily rate quoted in jobs citing Data Protection in London.

Daily rate trend for Data Protection in London

Data Protection
Daily Rate Histogram in London

Daily rate distribution for jobs citing Data Protection in London over the 6 months to 1 July 2025.

Daily rate histogram for Data Protection in London

Data Protection
Contractor Hourly Rate Trend in London

3-month moving average hourly rates quoted in jobs citing Data Protection in London.

Hourly rate trend for Data Protection in London

Data Protection
Contract Job Locations in London

The table below looks at the demand and provides a guide to the median contractor rates quoted in IT jobs citing Data Protection within the London region over the 6 months to 1 July 2025. The 'Rank Change' column provides an indication of the change in demand within each location based on the same 6 month period last year.

Location Rank Change
on Same Period
Last Year
Matching
Contract
IT Job Ads
Median
Daily Rate
Past 6 Months
Median Daily Rate
% Change
on Same Period
Last Year
Live
Jobs
Central London +8 33 £575 -1.29% 149
South London +4 10 £734 +50.51% 23
West London +8 5 £363 +26.09% 32
East London +3 1 - - 47
Data Protection
England

Data Protection
Co-occurring Skills and Capabilities in London by Category

The follow tables expand on the table above by listing co-occurrences grouped by category. The same employment type, locality and period is covered with up to 20 co-occurrences shown in each of the following categories:

Application Platforms
1 16 (4.35%) SharePoint
2 13 (3.53%) Confluence
3 6 (1.63%) CMS
4 5 (1.36%) Microsoft Exchange
5 2 (0.54%) Anypoint
5 2 (0.54%) JBoss
5 2 (0.54%) Oracle Coherence
5 2 (0.54%) WebSphere
5 2 (0.54%) WebSphere Application Server
6 1 (0.27%) Apache
6 1 (0.27%) Apache Spark
6 1 (0.27%) BizTalk Server
6 1 (0.27%) nginx
6 1 (0.27%) SAS
Applications
1 13 (3.53%) Microsoft Excel
2 8 (2.17%) MS Visio
3 7 (1.90%) Microsoft Office
4 4 (1.09%) Microsoft PowerPoint
4 4 (1.09%) Trello
5 3 (0.82%) Chatbot
6 1 (0.27%) Acrobat
6 1 (0.27%) Microsoft Project
Business Applications
1 2 (0.54%) Aladdin
1 2 (0.54%) BASE24
1 2 (0.54%) ResourceLink
1 2 (0.54%) Salesforce CRM
1 2 (0.54%) VisionPLUS
2 1 (0.27%) Dynamics CRM
2 1 (0.27%) Dynamics NAV
2 1 (0.27%) Endur
2 1 (0.27%) iTrent
2 1 (0.27%) Markit EDM
2 1 (0.27%) Oracle EBS R12
2 1 (0.27%) Oracle ERP
2 1 (0.27%) Oracle Financials
2 1 (0.27%) Oracle Receivables
2 1 (0.27%) Oracle Subledger Accounting
2 1 (0.27%) SAP GRC
2 1 (0.27%) SAP HCM
2 1 (0.27%) SAP S/4HANA
2 1 (0.27%) Sparx Enterprise Architect
Cloud Services
1 74 (20.11%) AWS
2 65 (17.66%) Azure
3 25 (6.79%) GCP
3 25 (6.79%) Microsoft 365
4 20 (5.43%) Power Platform
5 19 (5.16%) SaaS
6 18 (4.89%) GitHub
7 14 (3.80%) Microsoft Purview
8 13 (3.53%) Amazon S3
8 13 (3.53%) Entra ID
9 11 (2.99%) Serverless
10 9 (2.45%) Cloud Computing
11 8 (2.17%) AWS Lambda
11 8 (2.17%) PaaS
12 7 (1.90%) Azure DevOps
12 7 (1.90%) IaaS
12 7 (1.90%) Lucidchart
13 6 (1.63%) Azure Sentinel
13 6 (1.63%) OneDrive
13 6 (1.63%) SuccessFactors
Communications & Networking
1 20 (5.43%) Firewall
2 13 (3.53%) DNS
3 10 (2.72%) DHCP
4 7 (1.90%) VPN
5 6 (1.63%) VLAN
6 4 (1.09%) HTTPS
6 4 (1.09%) Network Security
6 4 (1.09%) SAN
6 4 (1.09%) TCP/IP
7 3 (0.82%) SSL
7 3 (0.82%) WAN
7 3 (0.82%) Wi-Fi
8 2 (0.54%) ATM
8 2 (0.54%) HTTP
8 2 (0.54%) iSCSI
8 2 (0.54%) LAN
8 2 (0.54%) LTE
8 2 (0.54%) NAS
8 2 (0.54%) SMTP
8 2 (0.54%) Wireless
Database & Business Intelligence
1 13 (3.53%) Power BI
2 10 (2.72%) SQL Server
3 8 (2.17%) Metadata
4 6 (1.63%) Tableau
5 5 (1.36%) Data Lake
5 5 (1.36%) DynamoDB
5 5 (1.36%) PostgreSQL
6 3 (0.82%) Azure SQL Database
6 3 (0.82%) Data Warehouse
6 3 (0.82%) MongoDB
6 3 (0.82%) Oracle Database
7 2 (0.54%) Amazon Athena
7 2 (0.54%) Amazon RDS
7 2 (0.54%) DB2
7 2 (0.54%) Electronic Patient Records
7 2 (0.54%) Hazelcast
7 2 (0.54%) NoSQL
7 2 (0.54%) Redis
7 2 (0.54%) Relational Database
7 2 (0.54%) Snowflake Schema
Development Applications
1 21 (5.71%) JIRA
2 8 (2.17%) Burp Suite
2 8 (2.17%) Jenkins
2 8 (2.17%) Metasploit
2 8 (2.17%) SonarQube
3 5 (1.36%) Git
3 5 (1.36%) GitLab
4 3 (0.82%) TeamCity
5 2 (0.54%) ERwin
5 2 (0.54%) Octopus Deploy
6 1 (0.27%) Bitbucket
6 1 (0.27%) Cypress.io
6 1 (0.27%) ER Studio
6 1 (0.27%) Gemini Tracker
6 1 (0.27%) Maven
6 1 (0.27%) MLflow
6 1 (0.27%) Team Foundation Server
General
1 121 (32.88%) Social Skills
2 89 (24.18%) Finance
3 50 (13.59%) Analytical Skills
4 24 (6.52%) Legal
5 21 (5.71%) Banking
6 19 (5.16%) Front Office
7 17 (4.62%) Public Sector
8 13 (3.53%) Law
9 11 (2.99%) Back Office
10 10 (2.72%) Marketing
11 8 (2.17%) Inclusion and Diversity
11 8 (2.17%) Presentation Skills
12 7 (1.90%) Documentation Skills
12 7 (1.90%) Organisational Skills
13 6 (1.63%) Police
14 5 (1.36%) Advertising
14 5 (1.36%) Local Government
15 4 (1.09%) Influencing Skills
16 3 (0.82%) German Language
16 3 (0.82%) Military
Job Titles
1 47 (12.77%) Analyst
2 30 (8.15%) Architect
2 30 (8.15%) Lead
3 27 (7.34%) Developer
4 26 (7.07%) Senior
5 23 (6.25%) Business Analyst
6 20 (5.43%) Consultant
7 16 (4.35%) Project Manager
8 14 (3.80%) Security Engineer
9 12 (3.26%) Data Analyst
10 11 (2.99%) Site Engineer
10 11 (2.99%) Site Reliability Engineer
11 10 (2.72%) Administrator
12 9 (2.45%) Cybersecurity Engineer
13 8 (2.17%) Applications Support
13 8 (2.17%) AWS Engineer
13 8 (2.17%) Support Engineer
14 7 (1.90%) IT Manager
14 7 (1.90%) Junior
14 7 (1.90%) Python Developer
Libraries, Frameworks & Software Standards
1 11 (2.99%) RESTful
2 7 (1.90%) Kafka
2 7 (1.90%) React
3 6 (1.63%) XML
4 5 (1.36%) Middleware
5 4 (1.09%) .NET
5 4 (1.09%) FIX Protocol
5 4 (1.09%) GraphQL
5 4 (1.09%) OAuth
5 4 (1.09%) Spring
6 3 (0.82%) ARM Templates
6 3 (0.82%) AWS CDK
6 3 (0.82%) Azure Blueprints
6 3 (0.82%) SOAP
7 2 (0.54%) EJB
7 2 (0.54%) FHIR
7 2 (0.54%) JWT
7 2 (0.54%) Lightning Web Components
7 2 (0.54%) Web Services
7 2 (0.54%) XSLT
Miscellaneous
1 198 (53.80%) Data Protection Act
2 17 (4.62%) Management Information System
3 12 (3.26%) Onboarding
4 11 (2.99%) Self-Motivation
5 10 (2.72%) Data Centre
5 10 (2.72%) Hybrid Cloud
5 10 (2.72%) Insider Threat
6 8 (2.17%) Derivative
6 8 (2.17%) Linux Command Line
7 5 (1.36%) Cloud Native
7 5 (1.36%) Freedom of Information
7 5 (1.36%) Virtual Team
8 4 (1.09%) Cyber Threat
8 4 (1.09%) Foreign Exchange (FX)
8 4 (1.09%) Legacy Applications
8 4 (1.09%) Market Risk
8 4 (1.09%) NHS
8 4 (1.09%) Public Cloud
8 4 (1.09%) Replication
8 4 (1.09%) Security Posture
Operating Systems
1 36 (9.78%) Linux
2 34 (9.24%) Windows
3 12 (3.26%) Unix
4 8 (2.17%) Windows Server
5 6 (1.63%) Red Hat Enterprise Linux
6 5 (1.36%) Windows 10
7 3 (0.82%) Apple iOS
7 3 (0.82%) CentOS
8 2 (0.54%) AIX
8 2 (0.54%) Android
8 2 (0.54%) Mac OS
8 2 (0.54%) Solaris
9 1 (0.27%) HPUX
9 1 (0.27%) Oracle Linux
Processes & Methodologies
1 70 (19.02%) Problem-Solving
2 52 (14.13%) Migration
3 49 (13.32%) Project Management
4 47 (12.77%) CI/CD
5 46 (12.50%) Stakeholder Management
6 43 (11.68%) Agile
7 35 (9.51%) Cybersecurity
8 34 (9.24%) DevOps
8 34 (9.24%) Risk Management
9 32 (8.70%) Continuous Improvement
9 32 (8.70%) Infrastructure as Code
10 29 (7.88%) Information Security
11 27 (7.34%) Cloud Security
11 27 (7.34%) Roadmaps
12 26 (7.07%) ITIL
12 26 (7.07%) Stakeholder Engagement
13 23 (6.25%) Analytics
14 22 (5.98%) Artificial Intelligence
14 22 (5.98%) Computer Science
15 21 (5.71%) Mentoring
Programming Languages
1 71 (19.29%) Python
2 46 (12.50%) SQL
3 25 (6.79%) PowerShell
4 19 (5.16%) Bash
5 17 (4.62%) JavaScript
6 15 (4.08%) C#
7 14 (3.80%) Java
8 8 (2.17%) TypeScript
9 7 (1.90%) Go
10 5 (1.36%) C++
10 5 (1.36%) PHP
11 4 (1.09%) Shell Script
12 3 (0.82%) Bicep
12 3 (0.82%) COBOL
12 3 (0.82%) Perl
12 3 (0.82%) PL/SQL
13 2 (0.54%) ActionScript
13 2 (0.54%) REXX
13 2 (0.54%) VBA
13 2 (0.54%) VBScript
Qualifications
1 43 (11.68%) Degree
2 30 (8.15%) Security Cleared
3 26 (7.07%) SC Cleared
4 17 (4.62%) Computer Science Degree
5 15 (4.08%) CISSP
6 13 (3.53%) CISM
6 13 (3.53%) Microsoft Certification
7 9 (2.45%) Cisco Certification
8 8 (2.17%) AWS Certification
8 8 (2.17%) CHECK Team Member
8 8 (2.17%) CREST Certified
8 8 (2.17%) OSCP
8 8 (2.17%) Tigerscheme
9 7 (1.90%) CCNP
10 6 (1.63%) PMI Certification
10 6 (1.63%) PMP
11 4 (1.09%) Azure Certification
11 4 (1.09%) CCIE
11 4 (1.09%) Master's Degree
12 3 (0.82%) AWS Certified Solutions Architect
Quality Assurance & Compliance
1 45 (12.23%) GDPR
2 14 (3.80%) QA
2 14 (3.80%) SOC 2
3 13 (3.53%) California Consumer Privacy Act
4 12 (3.26%) NIST
5 11 (2.99%) HIPAA
6 9 (2.45%) Cyber Essentials
7 8 (2.17%) Cyber Essentials PLUS
7 8 (2.17%) NCSC
8 7 (1.90%) ISO/IEC 27001
9 5 (1.36%) Data Quality
9 5 (1.36%) PERC
10 4 (1.09%) COBIT
10 4 (1.09%) GRC
10 4 (1.09%) PMO
11 3 (0.82%) Accessibility
11 3 (0.82%) DICOM
11 3 (0.82%) HL7
11 3 (0.82%) Sarbanes-Oxley
12 2 (0.54%) PCI DSS
System Software
1 28 (7.61%) Active Directory
2 12 (3.26%) VMware Infrastructure
3 10 (2.72%) Docker
4 3 (0.82%) Virtual Desktop
4 3 (0.82%) Virtual Machines
5 2 (0.54%) Oracle RAC
6 1 (0.27%) BitLocker
6 1 (0.27%) Hyper-V
6 1 (0.27%) Microsoft App-V
6 1 (0.27%) VMware ESXi
6 1 (0.27%) VMware NSX
6 1 (0.27%) vSphere
Systems Management
1 18 (4.89%) Kubernetes
2 16 (4.35%) Terraform
3 11 (2.99%) CASB
4 8 (2.17%) Nmap
5 7 (1.90%) Ansible
6 6 (1.63%) Grafana
6 6 (1.63%) Microsoft Intune
6 6 (1.63%) Prometheus
7 5 (1.36%) SCCM
8 3 (0.82%) NetBackup
8 3 (0.82%) Oracle RMAN
8 3 (0.82%) Single Sign-On
9 2 (0.54%) Data Guard
9 2 (0.54%) HP ALM
10 1 (0.27%) EMC NetWorker
10 1 (0.27%) FortiGate
10 1 (0.27%) Netcool
10 1 (0.27%) Tivoli
10 1 (0.27%) Tivoli Storage Manager
10 1 (0.27%) vCenter Server
Vendors
1 54 (14.67%) Microsoft
2 14 (3.80%) Oracle
3 13 (3.53%) Salesforce
4 12 (3.26%) Cisco
4 12 (3.26%) ServiceNow
4 12 (3.26%) VMware
5 10 (2.72%) Google
6 9 (2.45%) SAP
6 9 (2.45%) Splunk
7 8 (2.17%) IBM
7 8 (2.17%) Veracode
8 7 (1.90%) Red Hat
9 5 (1.36%) Dell
9 5 (1.36%) F5
9 5 (1.36%) OneTrust
10 4 (1.09%) Apple
10 4 (1.09%) Hitachi
10 4 (1.09%) HP
10 4 (1.09%) Juniper
10 4 (1.09%) MuleSoft