Taxonomies Jobs in England

Taxonomy
UK > England

The table below looks at the prevalence of the term Taxonomies in permanent job vacancies in England. Included is a benchmarking guide to the salaries offered in vacancies that cited Taxonomies over the 6 months leading up to 30 May 2025, comparing them to the same period in the previous two years.

6 months to
30 May 2025
Same period 2024 Same period 2023
Rank 628 773 803
Rank change year-on-year +145 +30 +223
Permanent jobs citing Taxonomies 57 70 94
As % of all permanent jobs advertised in England 0.12% 0.078% 0.11%
As % of the Miscellaneous category 0.31% 0.23% 0.25%
Number of salaries quoted 37 48 59
10th Percentile - £41,250 £49,750
25th Percentile £45,000 £52,456 £52,500
Median annual salary (50th Percentile) £74,500 £71,250 £65,000
Median % change year-on-year +4.56% +9.62% -16.13%
75th Percentile £115,000 £87,500 £82,500
90th Percentile £117,500 £117,500 £119,500
UK median annual salary £74,500 £70,000 £60,249
% change year-on-year +6.43% +16.18% -22.26%

All Generic Skills
England

Taxonomies falls under the General and Transferable Skills category. For comparison with the information above, the following table provides summary statistics for all permanent job vacancies requiring generic IT skills in England.

Permanent vacancies with a requirement for generic IT skills 18,503 30,294 38,072
As % of all permanent jobs advertised in England 37.79% 33.86% 44.07%
Number of salaries quoted 8,514 20,923 20,470
10th Percentile £31,000 £28,000 £35,764
25th Percentile £42,000 £38,000 £46,749
Median annual salary (50th Percentile) £60,000 £55,000 £65,000
Median % change year-on-year +9.09% -15.38% +4.00%
75th Percentile £80,000 £75,000 £87,500
90th Percentile £110,000 £100,000 £110,000
UK median annual salary £60,000 £55,000 £65,000
% change year-on-year +9.09% -15.38% +4.00%

Taxonomies
Job Vacancy Trend in England

Job postings citing Taxonomies as a proportion of all IT jobs advertised in England.
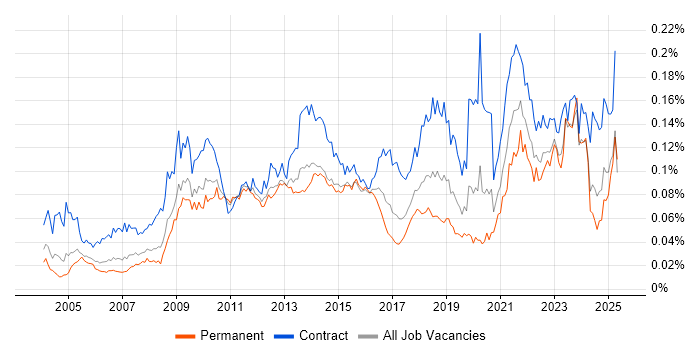
Job vacancy trend for Taxonomies in England

Taxonomies
Salary Trend in England

3-month moving average salary quoted in jobs citing Taxonomies in England.

Salary trend for Taxonomies in England

Taxonomies
Salary Histogram in England

Salary distribution for jobs citing Taxonomies in England over the 6 months to 30 May 2025.

Salary histogram for Taxonomies in England

Taxonomies
Job Locations in England

The table below looks at the demand and provides a guide to the median salaries quoted in IT jobs citing Taxonomies within the England region over the 6 months to 30 May 2025. The 'Rank Change' column provides an indication of the change in demand within each location based on the same 6 month period last year.

Location Rank Change
on Same Period
Last Year
Matching
Permanent
IT Job Ads
Median Salary
Past 6 Months
Median Salary
% Change
on Same Period
Last Year
Live
Jobs
London +117 22 £102,500 -2.38% 18
South East +84 14 - - 35
Midlands +80 8 £45,000 -17.92% 23
West Midlands +52 8 £45,000 -17.92% 11
North of England +53 5 £56,504 - 21
Yorkshire - 3 £56,000 - 7
North East +48 2 - - 2
North West +8 2 £65,502 - 12
South West +92 1 £143,500 +97.93% 10
Taxonomies
UK

Taxonomies
Co-occurring Skills and Capabilities in England by Category

The follow tables expand on the table above by listing co-occurrences grouped by category. The same employment type, locality and period is covered with up to 20 co-occurrences shown in each of the following categories:

Application Platforms
1 3 (5.26%) SharePoint
2 2 (3.51%) SharePoint Server
3 1 (1.75%) CMS
Applications
1 1 (1.75%) Microsoft Office
Business Applications
1 12 (21.05%) NetSuite
2 1 (1.75%) Dynamics CRM
2 1 (1.75%) Dynamics GP
2 1 (1.75%) Payment Gateway
2 1 (1.75%) Shopify
Cloud Services
1 14 (24.56%) Salsify
2 10 (17.54%) Azure
3 3 (5.26%) Microsoft 365
3 3 (5.26%) Power Platform
4 1 (1.75%) Amazon Neptune
4 1 (1.75%) Azure Synapse Analytics
4 1 (1.75%) Collibra
4 1 (1.75%) Entra ID
4 1 (1.75%) Microsoft Purview
4 1 (1.75%) OneDrive
4 1 (1.75%) ShareGate
Communications & Networking
1 2 (3.51%) HTTPS
2 1 (1.75%) Intranet
Database & Business Intelligence
1 24 (42.11%) Metadata
2 3 (5.26%) Power BI
3 2 (3.51%) Data Lake
3 2 (3.51%) SQL Server
4 1 (1.75%) Data Warehouse
4 1 (1.75%) Endeca
4 1 (1.75%) NoSQL
4 1 (1.75%) PostgreSQL
4 1 (1.75%) SQL Server Integration Services
4 1 (1.75%) SQL Server Reporting Services
Development Applications
1 1 (1.75%) GitLab
1 1 (1.75%) Jenkins
1 1 (1.75%) Selenium
General
1 37 (64.91%) Social Skills
2 29 (50.88%) Analytical Skills
3 28 (49.12%) Finance
4 20 (35.09%) Legal
5 16 (28.07%) Marketing
6 14 (24.56%) Law
7 9 (15.79%) Retail
8 7 (12.28%) Banking
9 2 (3.51%) Influencing Skills
10 1 (1.75%) Presentation Skills
Job Titles
1 17 (29.82%) Senior
2 15 (26.32%) Analyst
3 14 (24.56%) Senior Manager
4 13 (22.81%) Business Analyst
5 12 (21.05%) Architect
5 12 (21.05%) CRM Analyst
5 12 (21.05%) CRM Business Analyst
5 12 (21.05%) CRM Systems Analyst
5 12 (21.05%) Finance Business Analyst
5 12 (21.05%) Finance Systems Analyst
5 12 (21.05%) Financial Analyst
5 12 (21.05%) Financial Business Analyst
5 12 (21.05%) Systems Analyst
6 11 (19.30%) Data Architect
7 6 (10.53%) Principal Architect
7 6 (10.53%) Principal Data Architect
8 5 (8.77%) Cloud Architect
8 5 (8.77%) Strategy Architect
9 4 (7.02%) Security Specialist
10 3 (5.26%) Enterprise Architect
Libraries, Frameworks & Software Standards
1 3 (5.26%) OAuth
1 3 (5.26%) OAuth2
1 3 (5.26%) SOAP
2 2 (3.51%) JDBC
2 2 (3.51%) JSON
2 2 (3.51%) OpenID
3 1 (1.75%) .NET
3 1 (1.75%) FastAPI
3 1 (1.75%) Hugging Face
3 1 (1.75%) JSON-LD
3 1 (1.75%) JWT
3 1 (1.75%) LDAP
3 1 (1.75%) Plotly
3 1 (1.75%) RESTful
3 1 (1.75%) XML
Miscellaneous
1 19 (33.33%) Management Information System
2 12 (21.05%) Legacy Systems
3 7 (12.28%) Security Posture
4 2 (3.51%) PKI
5 1 (1.75%) Analytical Mindset
5 1 (1.75%) Cyber Threat
5 1 (1.75%) Data Fabric
5 1 (1.75%) FMCG
5 1 (1.75%) Foreign Exchange (FX)
5 1 (1.75%) Freedom of Information
5 1 (1.75%) Greenfield Project
5 1 (1.75%) Life Science
5 1 (1.75%) Onboarding
5 1 (1.75%) Reference Data
Operating Systems
1 1 (1.75%) Windows Server 2016
Processes & Methodologies
1 35 (61.40%) Agile
1 35 (61.40%) Problem-Solving
2 34 (59.65%) Roadmaps
3 26 (45.61%) Change Management
4 24 (42.11%) Analytics
4 24 (42.11%) Data Management
5 23 (40.35%) Artificial Intelligence
6 20 (35.09%) Data Collection
6 20 (35.09%) Information Security
6 20 (35.09%) Strategic Thinking
7 17 (29.82%) Metadata Management
7 17 (29.82%) Stakeholder Engagement
8 16 (28.07%) Collaborative Culture
8 16 (28.07%) Continuous Improvement
8 16 (28.07%) Data Integration
9 15 (26.32%) Architectural Patterns
9 15 (26.32%) Content Management
9 15 (26.32%) Decision-Making
9 15 (26.32%) Generative AI
9 15 (26.32%) Line Management
Programming Languages
1 3 (5.26%) Java
1 3 (5.26%) SQL
2 2 (3.51%) JavaScript
3 1 (1.75%) C#
3 1 (1.75%) Gremlin
3 1 (1.75%) PowerShell
3 1 (1.75%) Python
3 1 (1.75%) SPARQL
Qualifications
1 11 (19.30%) Degree
2 8 (14.04%) Master's Degree
3 7 (12.28%) CISM
3 7 (12.28%) CRISC
4 2 (3.51%) Computer Science Degree
5 1 (1.75%) CISA
5 1 (1.75%) MBA
5 1 (1.75%) Postgraduate
5 1 (1.75%) SC Cleared
5 1 (1.75%) Security Cleared
Quality Assurance & Compliance
1 15 (26.32%) Data Quality
2 9 (15.79%) ISO/IEC 27001
2 9 (15.79%) NIST
3 7 (12.28%) GRC
3 7 (12.28%) SOC 1
3 7 (12.28%) SOC 2
4 6 (10.53%) NIST 800
5 4 (7.02%) GDPR
6 2 (3.51%) COBIT
7 1 (1.75%) California Consumer Privacy Act
7 1 (1.75%) Cyber Essentials
7 1 (1.75%) PCI DSS
System Software
1 1 (1.75%) Docker
Systems Management
1 7 (12.28%) RSA Archer
2 2 (3.51%) Single Sign-On
Vendors
1 13 (22.81%) Salesforce
2 3 (5.26%) Microsoft
3 2 (3.51%) ForgeRock
3 2 (3.51%) Informatica
4 1 (1.75%) Ahrefs
4 1 (1.75%) CyberSource
4 1 (1.75%) Databricks
4 1 (1.75%) Nintex
4 1 (1.75%) Oracle
4 1 (1.75%) Sage