FMCG Jobs in England

Fast Moving Consumer Goods (FMCG)
UK > England

The table below looks at the prevalence of the term FMCG in permanent job vacancies in England. Included is a benchmarking guide to the salaries offered in vacancies that cited FMCG over the 6 months leading up to 26 July 2024, comparing them to the same period in the previous two years.

6 months to
26 Jul 2024
Same period 2023 Same period 2022
Rank 532 600 728
Rank change year-on-year +68 +128 -101
Permanent jobs citing FMCG 284 238 505
As % of all permanent jobs advertised in England 0.36% 0.33% 0.34%
As % of the Miscellaneous category 1.10% 0.80% 0.73%
Number of salaries quoted 199 134 239
10th Percentile £30,600 £31,250 £36,250
25th Percentile £39,313 £45,313 £43,125
Median annual salary (50th Percentile) £55,000 £60,000 £53,500
Median % change year-on-year -8.33% +12.15% +1.90%
75th Percentile £73,750 £80,000 £75,000
90th Percentile £97,500 £87,500 £92,750
UK median annual salary £55,000 £60,000 £55,000
% change year-on-year -8.33% +9.09% +4.76%

All Generic Skills
England

FMCG falls under the General and Transferable Skills category. For comparison with the information above, the following table provides summary statistics for all permanent job vacancies requiring generic IT skills in England.

Permanent vacancies with a requirement for generic IT skills 25,806 29,571 69,564
As % of all permanent jobs advertised in England 32.93% 41.60% 47.31%
Number of salaries quoted 16,283 18,664 32,310
10th Percentile £30,000 £35,408 £34,506
25th Percentile £40,523 £46,570 £46,000
Median annual salary (50th Percentile) £56,124 £65,000 £62,500
Median % change year-on-year -13.66% +4.00% +4.17%
75th Percentile £78,750 £85,000 £85,000
90th Percentile £102,500 £110,000 £105,000
UK median annual salary £55,000 £64,000 £62,500
% change year-on-year -14.06% +2.40% +4.17%

FMCG
Job Vacancy Trend in England

Job postings citing FMCG as a proportion of all IT jobs advertised in England.
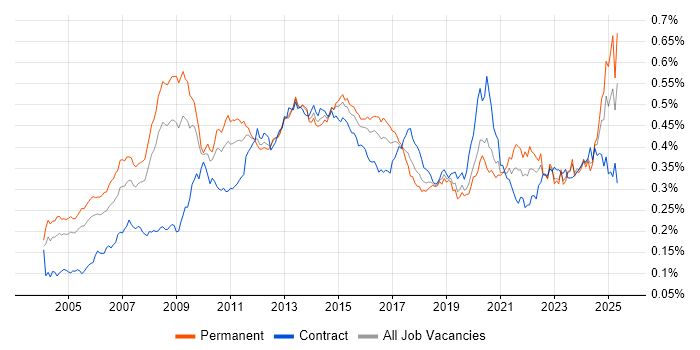
Job vacancy trend for FMCG in England

FMCG
Salary Trend in England

3-month moving average salary quoted in jobs citing FMCG in England.

Salary trend for FMCG in England

FMCG
Salary Histogram in England

Salary distribution for jobs citing FMCG in England over the 6 months to 26 July 2024.

Salary histogram for FMCG in England

FMCG
Job Locations in England

The table below looks at the demand and provides a guide to the median salaries quoted in IT jobs citing FMCG within the England region over the 6 months to 26 July 2024. The 'Rank Change' column provides an indication of the change in demand within each location based on the same 6 month period last year.

Location Rank Change
on Same Period
Last Year
Matching
Permanent
IT Job Ads
Median Salary
Past 6 Months
Median Salary
% Change
on Same Period
Last Year
Live
Jobs
Midlands +62 96 £50,000 +53.85% 43
West Midlands +43 56 £50,000 +5.26% 22
London +50 53 £61,500 +1.23% 27
North of England +7 49 £92,500 +141.83% 50
East Midlands +11 40 £50,000 +53.85% 21
South West +2 39 £40,000 -27.27% 9
South East -9 34 £57,500 -17.86% 30
Yorkshire +79 29 £92,500 +117.65% 22
North West -23 19 £89,750 +176.15% 27
East of England +6 12 £51,500 -20.77% 12
North East -19 1 £37,500 - 3
FMCG
UK

FMCG
Co-occurring Skills and Capabilities in England by Category

The follow tables expand on the table above by listing co-occurrences grouped by category. The same employment type, locality and period is covered with up to 20 co-occurrences shown in each of the following categories:

Application Platforms
1 17 (5.99%) SharePoint
2 6 (2.11%) ArcGIS
3 2 (0.70%) Oracle Collaboration Suite
4 1 (0.35%) Adobe Experience Manager
4 1 (0.35%) Anypoint
4 1 (0.35%) CMS
4 1 (0.35%) Confluence
Applications
1 16 (5.63%) Microsoft Excel
2 9 (3.17%) Microsoft Office
3 7 (2.46%) AutoCAD
3 7 (2.46%) Microsoft Project
4 6 (2.11%) Microsoft PowerPoint
5 5 (1.76%) Adobe Creative Suite
5 5 (1.76%) MS Visio
6 3 (1.06%) Photoshop
7 2 (0.70%) Adobe Illustrator
7 2 (0.70%) InDesign
7 2 (0.70%) Trello
8 1 (0.35%) Acrobat
8 1 (0.35%) Adobe Captivate
8 1 (0.35%) EPLAN
8 1 (0.35%) Spreadsheet
Business Applications
1 16 (5.63%) Dynamics CRM
1 16 (5.63%) SAP S/4HANA
2 15 (5.28%) Oracle Payables
2 15 (5.28%) Oracle Receivables
3 12 (4.23%) Oracle Assets
3 12 (4.23%) Oracle Cash Management
3 12 (4.23%) Oracle General Ledger
4 7 (2.46%) Magento
5 5 (1.76%) SAP IBP
5 5 (1.76%) SAP PP
5 5 (1.76%) SAP WM
6 4 (1.41%) Sage 200
7 2 (0.70%) NetSuite
7 2 (0.70%) SAP CO
7 2 (0.70%) SAP FI
7 2 (0.70%) SAP FI/CO
7 2 (0.70%) SAP MII
7 2 (0.70%) SAP SD
7 2 (0.70%) Shopify
8 1 (0.35%) Infor CloudSuite Industrial (formerly SyteLine)
Cloud Services
1 42 (14.79%) Power Platform
2 25 (8.80%) Azure
3 18 (6.34%) Dynamics 365
4 17 (5.99%) Azure DevOps
5 12 (4.23%) Microsoft 365
6 7 (2.46%) AWS
6 7 (2.46%) SuccessFactors
7 4 (1.41%) Smartsheet
8 3 (1.06%) Figma
9 2 (0.70%) Adobe Creative Cloud
9 2 (0.70%) Amazon EC2
9 2 (0.70%) Amazon ELB
9 2 (0.70%) Amazon S3
9 2 (0.70%) Entra ID
9 2 (0.70%) Power Automate
9 2 (0.70%) SaaS
9 2 (0.70%) Snowflake
10 1 (0.35%) GCP
10 1 (0.35%) GitHub
10 1 (0.35%) SAP Commerce Cloud
Communications & Networking
1 11 (3.87%) VLAN
2 8 (2.82%) Internet
3 7 (2.46%) BGP
3 7 (2.46%) EIGRP
3 7 (2.46%) HSRP
3 7 (2.46%) LAN
3 7 (2.46%) MPLS
3 7 (2.46%) OSPF
3 7 (2.46%) SD-WAN
3 7 (2.46%) Spanning Tree
3 7 (2.46%) VoIP
3 7 (2.46%) VRRP
3 7 (2.46%) WAN
3 7 (2.46%) Wireless
3 7 (2.46%) Wireshark
3 7 (2.46%) WLAN
4 6 (2.11%) Firewall
4 6 (2.11%) Network Security
5 5 (1.76%) RFID
6 4 (1.41%) Wi-Fi
Database & Business Intelligence
1 26 (9.15%) Power BI
2 6 (2.11%) SQL Server
3 3 (1.06%) GIS
4 2 (0.70%) Amazon RDS
4 2 (0.70%) BigQuery
4 2 (0.70%) Looker
4 2 (0.70%) Relational Database
4 2 (0.70%) Tableau
5 1 (0.35%) Amazon Redshift
5 1 (0.35%) Crystal Reports
5 1 (0.35%) Data Lake
5 1 (0.35%) Data Warehouse
5 1 (0.35%) SAP HANA
5 1 (0.35%) SQL Server Integration Services
5 1 (0.35%) SQL Server Reporting Services
Development Applications
1 17 (5.99%) Visual Studio
2 16 (5.63%) Team Foundation Server
3 3 (1.06%) PowerBuilder
4 2 (0.70%) GitLab
4 2 (0.70%) Jenkins
5 1 (0.35%) JIRA
General
1 116 (40.85%) Social Skills
2 87 (30.63%) Manufacturing
3 80 (28.17%) Retail
4 59 (20.77%) Finance
5 45 (15.85%) Analytical Skills
6 24 (8.45%) Marketing
7 22 (7.75%) Law
8 18 (6.34%) Influencing Skills
9 13 (4.58%) Automotive
9 13 (4.58%) Presentation Skills
10 11 (3.87%) Legal
11 10 (3.52%) Publishing
12 9 (3.17%) Pharmaceutical
13 7 (2.46%) Organisational Skills
14 6 (2.11%) French Language
15 4 (1.41%) Banking
15 4 (1.41%) German Language
16 3 (1.06%) Aerospace
17 2 (0.70%) Billing
17 2 (0.70%) Public Sector
Job Titles
1 53 (18.66%) Project Manager
2 40 (14.08%) Senior
3 36 (12.68%) Analyst
4 25 (8.80%) Architect
5 23 (8.10%) IT Manager
6 22 (7.75%) Lead
7 17 (5.99%) Consultant
8 13 (4.58%) Head of Business Systems
9 12 (4.23%) Oracle Specialist
9 12 (4.23%) Solutions Architect
10 11 (3.87%) Developer
10 11 (3.87%) Senior Manager
11 9 (3.17%) Business Analyst
11 9 (3.17%) Dynamics 365 Architect
11 9 (3.17%) Dynamics 365 Solution Architect
11 9 (3.17%) IT Project Manager
12 8 (2.82%) HR Manager
12 8 (2.82%) QA Leader
12 8 (2.82%) Senior Architect
12 8 (2.82%) Systems Developer
Libraries, Frameworks & Software Standards
1 20 (7.04%) Oracle Fusion
2 5 (1.76%) EDI
2 5 (1.76%) SAP TM
3 4 (1.41%) .NET
4 2 (0.70%) .NET Core
4 2 (0.70%) ASP.NET
4 2 (0.70%) Elastic Stack
4 2 (0.70%) HTML
4 2 (0.70%) WCF
4 2 (0.70%) XML
5 1 (0.35%) .NET Compact Framework
5 1 (0.35%) .NET Framework
5 1 (0.35%) ASP.NET MVC
5 1 (0.35%) ASP.NET Web API
5 1 (0.35%) Web Services
Miscellaneous
1 12 (4.23%) Self-Motivation
2 9 (3.17%) Renewable Energy
3 5 (1.76%) Photography
3 5 (1.76%) Product Ownership
4 4 (1.41%) CCTV
4 4 (1.41%) Management Information System
5 3 (1.06%) Driving Licence
5 3 (1.06%) Onboarding
5 3 (1.06%) Robotics
5 3 (1.06%) Virtual Team
6 2 (0.70%) Analytical Mindset
6 2 (0.70%) Cyber Defence
6 2 (0.70%) Enterprise Software
6 2 (0.70%) Greenfield Project
6 2 (0.70%) SCADA
7 1 (0.35%) Animation
7 1 (0.35%) CAN bus
7 1 (0.35%) Operational Technology
7 1 (0.35%) Security Posture
7 1 (0.35%) Video Conferencing
Operating Systems
1 4 (1.41%) Windows
2 3 (1.06%) Windows 10
3 2 (0.70%) Apple iOS
Processes & Methodologies
1 85 (29.93%) Project Management
2 58 (20.42%) ERP
3 52 (18.31%) Logistics
4 51 (17.96%) Change Management
5 43 (15.14%) Problem-Solving
6 40 (14.08%) Agile
7 39 (13.73%) Project Delivery
8 32 (11.27%) Stakeholder Management
9 26 (9.15%) Business Intelligence
9 26 (9.15%) Continuous Improvement
9 26 (9.15%) E-Commerce
10 24 (8.45%) Contract Negotiation
11 23 (8.10%) DevOps
11 23 (8.10%) Presales
12 21 (7.39%) Business Analysis
13 20 (7.04%) Supply Chain Management
13 20 (7.04%) User Stories
14 19 (6.69%) Analytics
14 19 (6.69%) Behavioural Change
14 19 (6.69%) CI/CD
Programming Languages
1 34 (11.97%) SQL
2 21 (7.39%) C#
3 4 (1.41%) Python
4 3 (1.06%) C
4 3 (1.06%) VBA
5 2 (0.70%) Bash
5 2 (0.70%) JavaScript
5 2 (0.70%) PL/SQL
5 2 (0.70%) VB
5 2 (0.70%) VB.NET
6 1 (0.35%) ABAP
6 1 (0.35%) Data Analysis Expressions
6 1 (0.35%) Java
6 1 (0.35%) R
Qualifications
1 49 (17.25%) Degree
2 15 (5.28%) Computer Science Degree
3 10 (3.52%) HNC
4 9 (3.17%) Cisco Certification
4 9 (3.17%) HND
5 8 (2.82%) Master's Degree
6 7 (2.46%) CCDP
6 7 (2.46%) CCIE
6 7 (2.46%) CCIE Routing and Switching
6 7 (2.46%) CCNP
7 4 (1.41%) PRINCE2 Certification
8 3 (1.06%) MBA
9 2 (0.70%) CCNA
10 1 (0.35%) CCA
10 1 (0.35%) PhD
10 1 (0.35%) PMI Certification
10 1 (0.35%) PMP
10 1 (0.35%) PRINCE2 Practitioner
10 1 (0.35%) Six Sigma Green Belt
Quality Assurance & Compliance
1 22 (7.75%) QA
2 17 (5.99%) Accessibility
3 15 (5.28%) PMO
4 6 (2.11%) NEBOSH
4 6 (2.11%) SLA
5 3 (1.06%) Data Quality
5 3 (1.06%) ISO/IEC 27001
6 2 (0.70%) Cyber Essentials
6 2 (0.70%) GRC
6 2 (0.70%) ISO 9001
6 2 (0.70%) NIST
7 1 (0.35%) GDPR
System Software
1 7 (2.46%) Firmware
2 6 (2.11%) Active Directory
3 4 (1.41%) Hyper-V
4 2 (0.70%) Docker
4 2 (0.70%) VMware Infrastructure
Systems Management
1 2 (0.70%) Ansible
1 2 (0.70%) Jamf Pro
1 2 (0.70%) Kubernetes
1 2 (0.70%) Microsoft Intune
1 2 (0.70%) Progress Chef
1 2 (0.70%) Terraform
Vendors
1 42 (14.79%) Microsoft
2 41 (14.44%) Oracle
3 40 (14.08%) SAP
4 18 (6.34%) IFS
5 15 (5.28%) Adobe
6 12 (4.23%) Cisco
7 10 (3.52%) Google
8 7 (2.46%) Ekahau
9 6 (2.11%) Autodesk
9 6 (2.11%) Siemens
10 4 (1.41%) Avaya
10 4 (1.41%) BT
10 4 (1.41%) Sage
10 4 (1.41%) WatchGuard
11 3 (1.06%) VMware
12 2 (0.70%) Allen-Bradley
12 2 (0.70%) AVEVA
12 2 (0.70%) Infor
12 2 (0.70%) Panasonic
12 2 (0.70%) SYSPRO