Selenium Jobs in England

Selenium
UK > England

The table below provides summary statistics for permanent job vacancies advertised in England requiring Selenium skills. It includes a benchmarking guide to the annual salaries offered in vacancies that cited Selenium over the 6 months leading up to 13 July 2025, comparing them to the same period in the previous two years.

6 months to
13 Jul 2025
Same period 2024 Same period 2023
Rank 344 445 189
Rank change year-on-year +101 -256 +10
Permanent jobs citing Selenium 403 484 1,429
As % of all permanent jobs advertised in England 0.77% 0.54% 1.89%
As % of the Development Applications category 8.06% 6.28% 13.85%
Number of salaries quoted 174 354 814
10th Percentile £41,250 £37,500 £40,118
25th Percentile £51,250 £45,563 £49,000
Median annual salary (50th Percentile) £60,000 £60,000 £60,000
75th Percentile £71,250 £79,688 £80,000
90th Percentile £83,375 £95,000 £95,000
UK median annual salary £57,500 £60,000 £60,000
% change year-on-year -4.17% - -

All Development Application Skills
England

Selenium falls under the Development Applications category. For comparison with the information above, the following table provides summary statistics for all permanent job vacancies requiring development application skills in England.

Permanent vacancies with a requirement for development application skills 4,997 7,712 10,319
As % of all permanent jobs advertised in England 9.52% 8.57% 13.65%
Number of salaries quoted 2,968 5,504 7,036
10th Percentile £37,574 £36,250 £41,250
25th Percentile £48,000 £45,000 £50,000
Median annual salary (50th Percentile) £62,000 £58,000 £65,000
Median % change year-on-year +6.90% -10.77% +4.00%
75th Percentile £77,500 £75,772 £82,500
90th Percentile £97,500 £93,750 £97,500
UK median annual salary £62,000 £57,500 £65,000
% change year-on-year +7.83% -11.54% +4.00%

Selenium
Job Vacancy Trend in England

Job postings citing Selenium as a proportion of all IT jobs advertised in England.
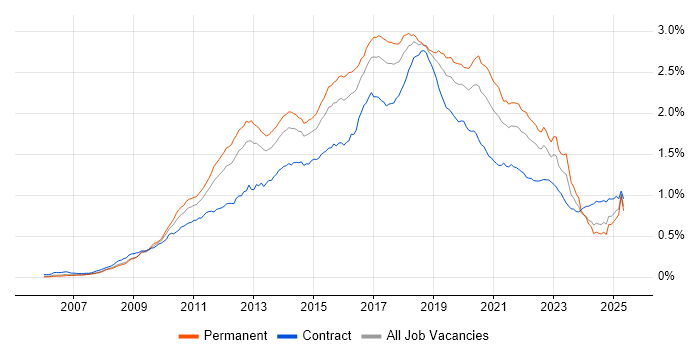
Job vacancy trend for Selenium in England

Selenium
Salary Trend in England

3-month moving average salary quoted in jobs citing Selenium in England.

Salary trend for Selenium in England

Selenium
Salary Histogram in England

Salary distribution for jobs citing Selenium in England over the 6 months to 13 July 2025.

Salary histogram for Selenium in England

Selenium
Job Locations in England

The table below looks at the demand and provides a guide to the median salaries quoted in IT jobs citing Selenium within the England region over the 6 months to 13 July 2025. The 'Rank Change' column provides an indication of the change in demand within each location based on the same 6 month period last year.

Location Rank Change
on Same Period
Last Year
Matching
Permanent
IT Job Ads
Median Salary
Past 6 Months
Median Salary
% Change
on Same Period
Last Year
Live
Jobs
North of England +109 148 £56,000 +24.44% 45
North West +96 129 £57,500 +27.78% 22
Midlands +153 93 £67,500 +16.45% 24
London +14 72 £57,500 -17.86% 79
West Midlands +93 47 £67,500 +26.21% 17
East Midlands +77 46 £65,000 +8.33% 7
South East -69 38 £60,000 -4.00% 50
East of England +57 31 £53,000 -7.83% 35
South West +91 19 £67,500 +28.57% 13
Yorkshire +21 14 £57,900 +28.67% 20
North East +42 5 £55,000 -5.11% 3
Selenium
UK

Selenium
Co-occurring Skills and Capabilities in England by Category

The follow tables expand on the table above by listing co-occurrences grouped by category. The same employment type, locality and period is covered with up to 20 co-occurrences shown in each of the following categories:

Application Platforms
1 124 (30.77%) Confluence
2 9 (2.23%) Apache Spark
3 8 (1.99%) Appian
4 7 (1.74%) Apache Airflow
5 3 (0.74%) nginx
5 3 (0.74%) Tomcat
6 2 (0.50%) Apache
7 1 (0.25%) Microsoft Exchange
7 1 (0.25%) SharePoint
Applications
1 2 (0.50%) Chatbot
2 1 (0.25%) Microsoft Office
2 1 (0.25%) MS Visio
Business Applications
1 5 (1.24%) Elite 3E
2 3 (0.74%) Payment Gateway
3 1 (0.25%) Dynamics CRM
3 1 (0.25%) Loan IQ
3 1 (0.25%) Magento
3 1 (0.25%) Siebel CRM
Cloud Services
1 268 (66.50%) Azure
2 258 (64.02%) AWS
3 119 (29.53%) GCP
4 39 (9.68%) Azure DevOps
5 23 (5.71%) GitHub
6 19 (4.71%) Serverless
7 17 (4.22%) SaaS
8 16 (3.97%) Amazon S3
9 12 (2.98%) Power Platform
10 10 (2.48%) Azure Data Factory
11 9 (2.23%) AWS Lambda
12 8 (1.99%) Azure Functions
13 7 (1.74%) Amazon Bedrock
13 7 (1.74%) Amazon ECS
13 7 (1.74%) Amazon EKS
13 7 (1.74%) Amazon SageMaker
13 7 (1.74%) MinIO
14 6 (1.49%) Azure Logic Apps
14 6 (1.49%) Azure Synapse Analytics
14 6 (1.49%) GitHub Actions
Communications & Networking
1 2 (0.50%) Internet
2 1 (0.25%) SAN
Database & Business Intelligence
1 208 (51.61%) SQL Server
2 19 (4.71%) PostgreSQL
3 15 (3.72%) Relational Database
4 14 (3.47%) NoSQL
5 13 (3.23%) MongoDB
6 8 (1.99%) Big Data
6 8 (1.99%) MySQL
7 5 (1.24%) Amazon Aurora
8 4 (0.99%) Delta Lake
9 3 (0.74%) Amazon RDS
9 3 (0.74%) Elasticsearch
9 3 (0.74%) Power BI
10 2 (0.50%) Airbyte
10 2 (0.50%) Data Warehouse
10 2 (0.50%) Endeca
10 2 (0.50%) Hadoop
10 2 (0.50%) Redis
11 1 (0.25%) SAP BW
11 1 (0.25%) SQL Server Integration Services
11 1 (0.25%) SQL Server Reporting Services
Development Applications
1 265 (65.76%) JIRA
2 224 (55.58%) Cucumber
3 218 (54.09%) GitLab
4 208 (51.61%) SonarQube
5 205 (50.87%) Bitbucket
6 204 (50.62%) Maven
7 202 (50.12%) Sonatype Nexus
8 48 (11.91%) Postman
9 42 (10.42%) Jenkins
10 39 (9.68%) Git
11 36 (8.93%) Cypress.io
12 32 (7.94%) JMeter
13 19 (4.71%) JUnit
13 19 (4.71%) WebDriver
14 17 (4.22%) Appium
15 14 (3.47%) LoadRunner
15 14 (3.47%) Locust
15 14 (3.47%) SoapUI
15 14 (3.47%) SpecFlow
16 12 (2.98%) Robot Framework
General
1 243 (60.30%) Finance
2 209 (51.86%) Inclusion and Diversity
3 207 (51.36%) Banking
4 95 (23.57%) Retail
5 93 (23.08%) Investment Banking
6 90 (22.33%) Corporate Banking
7 45 (11.17%) Social Skills
8 40 (9.93%) Analytical Skills
9 29 (7.20%) Law
10 22 (5.46%) Legal
11 11 (2.73%) Marketing
12 8 (1.99%) Cantonese Language
12 8 (1.99%) Mandarin Language
12 8 (1.99%) Public Sector
13 4 (0.99%) Financial Institution
14 3 (0.74%) Front Office
14 3 (0.74%) Manufacturing
15 2 (0.50%) Organisational Skills
15 2 (0.50%) Tech for Good
16 1 (0.25%) Advertising
Job Titles
1 219 (54.34%) Software Engineer
2 44 (10.92%) QA Engineer
3 40 (9.93%) Lead
4 39 (9.68%) Senior
5 37 (9.18%) Test Engineer
6 27 (6.70%) Automation Engineer
7 22 (5.46%) Test Automation Engineer
8 19 (4.71%) Developer
9 18 (4.47%) Analyst
9 18 (4.47%) Tester
10 16 (3.97%) Test Analyst
11 15 (3.72%) QA Automation Engineer
12 13 (3.23%) QA Leader
12 13 (3.23%) Validation Engineer
13 12 (2.98%) Senior QA Engineer
14 11 (2.73%) Java Engineer
15 9 (2.23%) Automation Tester
15 9 (2.23%) QA Test Engineer
15 9 (2.23%) Quality Engineer
16 8 (1.99%) Architect
Libraries, Frameworks & Software Standards
1 220 (54.59%) HTML
1 220 (54.59%) Kafka
2 217 (53.85%) CSS
3 212 (52.61%) Spring Boot
4 210 (52.11%) React
5 209 (51.86%) Spring
6 199 (49.38%) JPA
6 199 (49.38%) Redux
7 109 (27.05%) Hibernate
8 107 (26.55%) REST
9 101 (25.06%) RESTful
10 97 (24.07%) HTML5
10 97 (24.07%) Jest
11 92 (22.83%) CSS3
12 90 (22.33%) Sass
13 40 (9.93%) Playwright
14 22 (5.46%) pytest
15 20 (4.96%) .NET
16 14 (3.47%) JSON
16 14 (3.47%) SOAP
Miscellaneous
1 207 (51.36%) Product Ownership
2 199 (49.38%) Enterprise Software
3 13 (3.23%) Cloud Native
3 13 (3.23%) Operational Technology
3 13 (3.23%) SCADA
4 9 (2.23%) Low-Code
5 6 (1.49%) Client/Server
5 6 (1.49%) Mobile App
5 6 (1.49%) Wiki
6 3 (0.74%) Life Science
6 3 (0.74%) Mainframe
6 3 (0.74%) Self-Motivation
7 2 (0.50%) Algorithms
7 2 (0.50%) Data Structures
7 2 (0.50%) Greenfield Project
7 2 (0.50%) Onboarding
7 2 (0.50%) Public Cloud
7 2 (0.50%) Team-Oriented Environment
8 1 (0.25%) Driving Licence
8 1 (0.25%) EMC VMAX
Operating Systems
1 6 (1.49%) Linux
2 3 (0.74%) Windows
3 1 (0.25%) Apple iOS
Processes & Methodologies
1 369 (91.56%) Test Automation
2 313 (77.67%) Agile
3 298 (73.95%) CI/CD
4 271 (67.25%) DevOps
5 235 (58.31%) SDLC
5 235 (58.31%) Software Engineering
6 227 (56.33%) Microservices
7 206 (51.12%) Containerisation
8 205 (50.87%) Full-Stack Development
9 203 (50.37%) Performance Optimisation
10 201 (49.88%) Front End Development
11 133 (33.00%) Continuous Improvement
12 125 (31.02%) TDD
13 122 (30.27%) Mentoring
14 113 (28.04%) Clean Code
15 108 (26.80%) User Experience
16 93 (23.08%) Migration
17 92 (22.83%) Responsive Web Design
18 90 (22.33%) Strategic Thinking
19 60 (14.89%) Test Scripting
Programming Languages
1 262 (65.01%) Java
2 258 (64.02%) JavaScript
3 248 (61.54%) SQL
4 121 (30.02%) TypeScript
5 65 (16.13%) Python
6 43 (10.67%) C#
7 11 (2.73%) PHP
8 10 (2.48%) Go
9 6 (1.49%) Groovy
10 3 (0.74%) Scala
11 2 (0.50%) Ruby
11 2 (0.50%) T-SQL
12 1 (0.25%) C
12 1 (0.25%) C++
12 1 (0.25%) PowerShell
Qualifications
1 71 (17.62%) ISTQB
2 28 (6.95%) Degree
3 19 (4.71%) Security Cleared
4 14 (3.47%) SC Cleared
5 8 (1.99%) ISTQB Foundation Certification
6 7 (1.74%) ISEB
7 6 (1.49%) AWS Certification
8 5 (1.24%) DV Cleared
9 3 (0.74%) AWS Certified Cloud Practitioner
9 3 (0.74%) AWS Certified Developer
9 3 (0.74%) Azure Certification
9 3 (0.74%) CISSP
9 3 (0.74%) Computer Science Degree
9 3 (0.74%) OCP
9 3 (0.74%) Oracle Certification
10 2 (0.50%) BPSS Clearance
10 2 (0.50%) ISTQB Advanced Certification
11 1 (0.25%) DBS Check
11 1 (0.25%) Master's Degree
Quality Assurance & Compliance
1 298 (73.95%) QA
2 99 (24.57%) Accessibility
3 3 (0.74%) GDPR
4 2 (0.50%) Software Quality Assurance
5 1 (0.25%) Data Quality
5 1 (0.25%) MiFID
5 1 (0.25%) PCI DSS
5 1 (0.25%) PSD2
System Software
1 237 (58.81%) Docker
2 5 (1.24%) VMware Infrastructure
3 1 (0.25%) Active Directory
Systems Management
1 236 (58.56%) Kubernetes
2 23 (5.71%) Terraform
3 15 (3.72%) Ansible
4 4 (0.99%) HP Quality Center
4 4 (0.99%) Progress Chef
5 3 (0.74%) Argo
5 3 (0.74%) Grafana
5 3 (0.74%) Istio
5 3 (0.74%) Kustomize
5 3 (0.74%) Packer
5 3 (0.74%) Prometheus
6 1 (0.25%) Microsoft Intune
6 1 (0.25%) Puppet
6 1 (0.25%) vRealize
Vendors
1 198 (49.13%) Solace
2 18 (4.47%) Microsoft
3 14 (3.47%) Databricks
4 8 (1.99%) Oracle
4 8 (1.99%) UiPath
4 8 (1.99%) VMware
5 7 (1.74%) BiZZdesign
5 7 (1.74%) Black Duck
6 3 (0.74%) Atlassian
6 3 (0.74%) Dynatrace
6 3 (0.74%) IBM
6 3 (0.74%) Red Hat
7 2 (0.50%) Blue Prism
7 2 (0.50%) Coverity
7 2 (0.50%) CyberSource
7 2 (0.50%) Google
7 2 (0.50%) Workday
8 1 (0.25%) Brocade
8 1 (0.25%) Spotify
8 1 (0.25%) Veracode