Single Sign-On Jobs in England

Single Sign-On (SSO)
UK > England

The table below provides summary statistics for permanent job vacancies advertised in England requiring Single Sign-On skills. It includes a benchmarking guide to the annual salaries offered in vacancies that cited Single Sign-On over the 6 months leading up to 26 July 2024, comparing them to the same period in the previous two years.

6 months to
26 Jul 2024
Same period 2023 Same period 2022
Rank 578 562 712
Rank change year-on-year -16 +150 -11
Permanent jobs citing Single Sign-On 229 285 526
As % of all permanent jobs advertised in England 0.29% 0.40% 0.36%
As % of the Systems Management category 3.17% 2.80% 2.01%
Number of salaries quoted 170 168 309
10th Percentile £44,911 £45,000 £40,853
25th Percentile £52,500 £54,938 £51,250
Median annual salary (50th Percentile) £69,000 £65,000 £63,000
Median % change year-on-year +6.15% +3.17% +5.00%
75th Percentile £84,919 £87,500 £82,500
90th Percentile £87,500 £100,000 £93,750
UK median annual salary £69,000 £70,000 £65,000
% change year-on-year -1.43% +7.69% +13.04%

All Systems Management Skills
England

Single Sign-On falls under the Systems Management category. For comparison with the information above, the following table provides summary statistics for all permanent job vacancies requiring systems management skills in England.

Permanent vacancies with a requirement for systems management skills 7,223 10,168 26,120
As % of all permanent jobs advertised in England 9.22% 14.30% 17.77%
Number of salaries quoted 5,245 7,528 12,568
10th Percentile £35,000 £35,400 £37,500
25th Percentile £46,000 £47,500 £47,500
Median annual salary (50th Percentile) £62,783 £67,500 £70,000
Median % change year-on-year -6.99% -3.57% +7.69%
75th Percentile £85,000 £87,500 £87,500
90th Percentile £101,250 £105,000 £102,500
UK median annual salary £62,500 £67,500 £67,500
% change year-on-year -7.41% - +3.85%

Single Sign-On
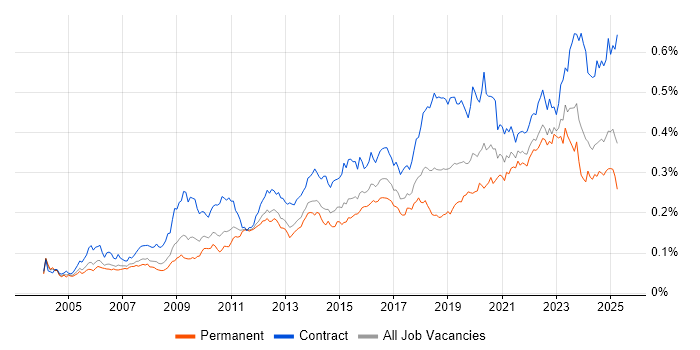
Job Vacancy Trend in England

Job postings citing Single Sign-On as a proportion of all IT jobs advertised in England.

Job vacancy trend for Single Sign-On in England

Single Sign-On
Salary Trend in England

3-month moving average salary quoted in jobs citing Single Sign-On in England.

Salary trend for Single Sign-On in England

Single Sign-On
Salary Histogram in England

Salary distribution for jobs citing Single Sign-On in England over the 6 months to 26 July 2024.

Salary histogram for Single Sign-On in England

Single Sign-On
Job Locations in England

The table below looks at the demand and provides a guide to the median salaries quoted in IT jobs citing Single Sign-On within the England region over the 6 months to 26 July 2024. The 'Rank Change' column provides an indication of the change in demand within each location based on the same 6 month period last year.

Location Rank Change
on Same Period
Last Year
Matching
Permanent
IT Job Ads
Median Salary
Past 6 Months
Median Salary
% Change
on Same Period
Last Year
Live
Jobs
London +59 108 £73,750 -7.81% 12
North of England -2 42 £79,842 +22.83% 8
South East -17 30 £61,000 +5.17% 4
North West -19 25 £67,387 -3.73% 6
Midlands -22 19 £55,000 +15.79% 5
South West +2 17 £45,000 -
West Midlands +1 17 £61,500 +29.47% 3
East of England -1 12 £70,000 +16.67%
Yorkshire +53 10 £79,842 +35.90% 1
North East -6 7 £71,312 +9.71% 1
East Midlands -33 2 £55,000 - 2
Single Sign-On
UK

Single Sign-On
Co-occurring Skills and Capabilities in England by Category

The follow tables expand on the table above by listing co-occurrences grouped by category. The same employment type, locality and period is covered with up to 20 co-occurrences shown in each of the following categories:

Application Platforms
1 30 (13.10%) Microsoft Exchange
2 12 (5.24%) WebLogic
3 9 (3.93%) Apache
3 9 (3.93%) JBoss
4 8 (3.49%) Skype for Business
5 6 (2.62%) Confluence
5 6 (2.62%) nginx
6 5 (2.18%) SharePoint
7 4 (1.75%) Oracle Workflow
8 3 (1.31%) GlassFish
8 3 (1.31%) Tomcat
9 2 (0.87%) IIS
9 2 (0.87%) Oracle SOA Suite
10 1 (0.44%) WordPress
Applications
1 10 (4.37%) Microsoft Office
2 4 (1.75%) Microsoft Excel
3 3 (1.31%) MS Visio
4 2 (0.87%) Trello
5 1 (0.44%) Microsoft PowerPoint
Business Applications
1 16 (6.99%) Remedy ITSM
2 2 (0.87%) SAP GRC
2 2 (0.87%) Temenos T24
3 1 (0.44%) Salesforce CRM
Cloud Services
1 131 (57.21%) Azure
2 87 (37.99%) AWS
3 59 (25.76%) Entra ID
4 50 (21.83%) Microsoft 365
5 15 (6.55%) SaaS
6 14 (6.11%) Google Workspace
7 11 (4.80%) IaaS
8 10 (4.37%) Mimecast
9 9 (3.93%) Azure DevOps
10 8 (3.49%) Akamai
10 8 (3.49%) Amazon CloudWatch
10 8 (3.49%) Amazon ECS
10 8 (3.49%) Amazon EKS
10 8 (3.49%) AWS KMS
10 8 (3.49%) Azure AKS
10 8 (3.49%) PaaS
11 7 (3.06%) Azure Key Vault
11 7 (3.06%) Cloud Computing
12 6 (2.62%) Datadog
12 6 (2.62%) GCP
Communications & Networking
1 54 (23.58%) Firewall
2 49 (21.40%) DNS
3 38 (16.59%) WAN
4 35 (15.28%) SD-WAN
5 29 (12.66%) VPN
6 18 (7.86%) Network Security
6 18 (7.86%) SSL
6 18 (7.86%) Wireless
7 17 (7.42%) DHCP
8 13 (5.68%) NAS
8 13 (5.68%) TCP/IP
9 11 (4.80%) BGP
9 11 (4.80%) Reverse Proxy
10 10 (4.37%) LAN
10 10 (4.37%) VoIP
11 9 (3.93%) Broadband
12 8 (3.49%) Internet
12 8 (3.49%) MPLS
12 8 (3.49%) OSPF
12 8 (3.49%) Skype
Database & Business Intelligence
1 16 (6.99%) SQL Server
2 12 (5.24%) Elasticsearch
3 5 (2.18%) Oracle Database
3 5 (2.18%) Relational Database
4 4 (1.75%) Azure SQL Database
4 4 (1.75%) SQL Server Integration Services
5 3 (1.31%) Amazon RDS
5 3 (1.31%) MongoDB
5 3 (1.31%) Oracle Database 12c
5 3 (1.31%) Oracle Reports
5 3 (1.31%) Power BI
6 2 (0.87%) OLAP
6 2 (0.87%) OLTP
6 2 (0.87%) Oracle OLAP
7 1 (0.44%) CockroachDB
7 1 (0.44%) PostgreSQL
Development Applications
1 25 (10.92%) JIRA
2 24 (10.48%) Jenkins
3 14 (6.11%) Bitbucket
3 14 (6.11%) GitLab
4 10 (4.37%) Git
5 5 (2.18%) SonarQube
5 5 (2.18%) TeamCity
6 4 (1.75%) Ant
6 4 (1.75%) Eclipse
7 3 (1.31%) Maven
8 1 (0.44%) IBM UrbanCode
8 1 (0.44%) MSI
8 1 (0.44%) Robot Framework
8 1 (0.44%) Selenium
8 1 (0.44%) Team Foundation Server
General
1 63 (27.51%) Social Skills
2 31 (13.54%) Analytical Skills
2 31 (13.54%) Finance
3 22 (9.61%) Inclusion and Diversity
4 17 (7.42%) Public Sector
5 16 (6.99%) Banking
6 14 (6.11%) Law
7 12 (5.24%) Police
8 9 (3.93%) Games
9 7 (3.06%) Investment Banking
9 7 (3.06%) Legal
10 6 (2.62%) Organisational Skills
10 6 (2.62%) Retail
11 5 (2.18%) Marketing
12 4 (1.75%) Back Office
13 3 (1.31%) Advertising
13 3 (1.31%) Financial Institution
14 1 (0.44%) Automotive
14 1 (0.44%) Publishing
14 1 (0.44%) Telecoms
Job Titles
1 42 (18.34%) Senior
2 41 (17.90%) Analyst
2 41 (17.90%) Architect
3 33 (14.41%) Lead
4 28 (12.23%) Developer
5 24 (10.48%) Lead Architect
5 24 (10.48%) Lead Security Architect
5 24 (10.48%) Security Architect
6 21 (9.17%) ServiceNow Developer
7 17 (7.42%) Infrastructure Engineer
8 16 (6.99%) Support Analyst
9 14 (6.11%) Security Engineer
10 12 (5.24%) Applications Support
10 12 (5.24%) Applications Support Analyst
10 12 (5.24%) Azure Engineer
10 12 (5.24%) Consultant
10 12 (5.24%) DevOps Engineer
10 12 (5.24%) Senior Analyst
10 12 (5.24%) Senior Applications Support
10 12 (5.24%) Senior Support Analyst
Libraries, Frameworks & Software Standards
1 38 (16.59%) LDAP
2 29 (12.66%) CSS
2 29 (12.66%) Web Services
3 27 (11.79%) HTML
3 27 (11.79%) OAuth
4 23 (10.04%) SAML
5 22 (9.61%) AngularJS
6 19 (8.30%) Twitter Bootstrap
6 19 (8.30%) XML
7 16 (6.99%) JSON
8 15 (6.55%) J2EE
9 14 (6.11%) Spring
10 13 (5.68%) Java EE
10 13 (5.68%) OpenID
11 11 (4.80%) Keycloak
12 10 (4.37%) 802.1X
12 10 (4.37%) ADO
12 10 (4.37%) SOAP
13 9 (3.93%) CSS3
13 9 (3.93%) HTML5
Miscellaneous
1 39 (17.03%) Management Information System
2 25 (10.92%) Public Cloud
3 24 (10.48%) Distributed Denial-of-Service
3 24 (10.48%) PKI
4 23 (10.04%) Hybrid Cloud
5 20 (8.73%) Enterprise Software
6 19 (8.30%) CMDB
7 18 (7.86%) Video Conferencing
8 16 (6.99%) Clustering
8 16 (6.99%) Onboarding
9 15 (6.55%) Data Centre
10 14 (6.11%) Cloud Native
11 10 (4.37%) Mobile App
12 9 (3.93%) Product Ownership
13 8 (3.49%) Client/Server
13 8 (3.49%) Self-Motivation
14 7 (3.06%) Security Posture
15 6 (2.62%) Distributed Systems
16 5 (2.18%) Cloud Security Posture
16 5 (2.18%) Linux Command Line
Operating Systems
1 84 (36.68%) Windows
2 58 (25.33%) Windows Server
3 34 (14.85%) Linux
4 21 (9.17%) Unix
5 15 (6.55%) Windows 10
6 13 (5.68%) Red Hat Enterprise Linux
7 12 (5.24%) Mac OS
8 6 (2.62%) Windows Server 2019
9 5 (2.18%) Windows Server 2016
10 4 (1.75%) Android
10 4 (1.75%) Windows Server 2012
11 3 (1.31%) AIX
11 3 (1.31%) Apple iOS
11 3 (1.31%) Solaris
12 2 (0.87%) Rocky
12 2 (0.87%) Ubuntu
13 1 (0.44%) HPUX
13 1 (0.44%) VMS
13 1 (0.44%) Windows Server 2008
13 1 (0.44%) Windows Vista
Processes & Methodologies
1 76 (33.19%) Identity Access Management
2 71 (31.00%) Identity Management
3 64 (27.95%) Information Security
4 53 (23.14%) ITIL
5 48 (20.96%) CI/CD
6 46 (20.09%) DevOps
7 39 (17.03%) Problem-Solving
8 35 (15.28%) Agile
9 34 (14.85%) Application Security
10 31 (13.54%) Mentoring
11 28 (12.23%) Cybersecurity
12 27 (11.79%) Multi-Factor Authentication
13 24 (10.48%) OWASP
13 24 (10.48%) Secure Coding
13 24 (10.48%) Security Architecture
13 24 (10.48%) Workflow
14 22 (9.61%) Scrum
15 21 (9.17%) ITSM
15 21 (9.17%) Service Management
16 20 (8.73%) Enterprise Architecture
Programming Languages
1 46 (20.09%) PowerShell
2 34 (14.85%) JavaScript
3 31 (13.54%) Bash
4 27 (11.79%) Python
5 25 (10.92%) Java
6 16 (6.99%) SQL
7 13 (5.68%) Shell Script
8 7 (3.06%) Perl
9 6 (2.62%) Apex Code
10 4 (1.75%) Go
11 2 (0.87%) C#
12 1 (0.44%) Bicep
12 1 (0.44%) C
12 1 (0.44%) Groovy
12 1 (0.44%) Kusto Query Language
12 1 (0.44%) Rust
Qualifications
1 35 (15.28%) CISSP
2 34 (14.85%) Security Cleared
3 31 (13.54%) AWS Certification
3 31 (13.54%) Cisco Certification
4 30 (13.10%) (ISC)2 CCSP
4 30 (13.10%) CCSP
5 29 (12.66%) CCSK
6 28 (12.23%) Azure Certification
7 27 (11.79%) CISM
8 25 (10.92%) SC Cleared
9 18 (7.86%) Degree
10 9 (3.93%) Microsoft Certification
11 4 (1.75%) CEH
12 2 (0.87%) Computer Science Degree
12 2 (0.87%) MCSA
12 2 (0.87%) VMware Certified Professional (VCP)
13 1 (0.44%) CCIE
13 1 (0.44%) CCNA
13 1 (0.44%) CCNP
13 1 (0.44%) MCSE
Quality Assurance & Compliance
1 34 (14.85%) NIST
2 22 (9.61%) ISO/IEC 27001
3 20 (8.73%) Cyber Essentials
4 12 (5.24%) SLA
4 12 (5.24%) SOC 2
5 6 (2.62%) NIST 800
6 4 (1.75%) PCI DSS
7 3 (1.31%) GRC
8 2 (0.87%) PMO
9 1 (0.44%) Cyber Essentials PLUS
9 1 (0.44%) GDPR
9 1 (0.44%) HIPAA
9 1 (0.44%) ISO/IEC 27002 (supersedes ISO/IEC 17799)
9 1 (0.44%) Sarbanes-Oxley
System Software
1 105 (45.85%) Active Directory
2 49 (21.40%) Docker
3 22 (9.61%) VMware Infrastructure
4 18 (7.86%) VMware ESXi
5 10 (4.37%) Hyper-V
5 10 (4.37%) XenApp
6 9 (3.93%) XenDesktop
7 6 (2.62%) Virtual Desktop
8 4 (1.75%) Virtual Machines
8 4 (1.75%) vSphere
9 3 (1.31%) Microsoft Virtual Server
9 3 (1.31%) Virtual Servers
10 1 (0.44%) DFS Replication
10 1 (0.44%) Firmware
10 1 (0.44%) OpenAM
10 1 (0.44%) OpenDJ
10 1 (0.44%) Shibboleth
10 1 (0.44%) Terminal Services
10 1 (0.44%) VMware NSX
Systems Management
1 52 (22.71%) Kubernetes
2 34 (14.85%) Microsoft Intune
2 34 (14.85%) Terraform
3 21 (9.17%) Ansible
4 20 (8.73%) Active Directory Federation Services
5 17 (7.42%) Puppet
6 16 (6.99%) vCenter Server
7 14 (6.11%) Progress Chef
7 14 (6.11%) SCCM
8 13 (5.68%) Microsoft Clustering
9 12 (5.24%) OpenSSO
10 8 (3.49%) Prometheus
11 7 (3.06%) CA Single Sign-On
12 6 (2.62%) Nagios
13 5 (2.18%) Jamf Pro
14 4 (1.75%) SCOM
15 3 (1.31%) NetIQ Identity Manager
15 3 (1.31%) Oracle Statspack
16 2 (0.87%) RSA Archer
16 2 (0.87%) SCOrch
Vendors
1 83 (36.24%) Microsoft
2 53 (23.14%) ServiceNow
3 51 (22.27%) VMware
4 35 (15.28%) Oracle
5 28 (12.23%) Remedy
6 22 (9.61%) Red Hat
7 20 (8.73%) HP
8 18 (7.86%) Google
8 18 (7.86%) Zscaler
9 16 (6.99%) BMC
10 14 (6.11%) CA
10 14 (6.11%) Commvault
11 13 (5.68%) Apple
11 13 (5.68%) ForgeRock
12 12 (5.24%) Cisco
12 12 (5.24%) Citrix
12 12 (5.24%) CyberArk
13 11 (4.80%) Sun
14 9 (3.93%) Fortinet
14 9 (3.93%) Ivanti