Publishing Jobs in the UK excluding London

Publishing
UK > UK excluding London

The table below looks at the prevalence of the term Publishing in permanent job vacancies advertised in the UK excluding London. Included is a benchmarking guide to the salaries offered in vacancies that have cited Publishing over the 6 months to 22 May 2024 with a comparison to the same period over the previous 2 years.

6 months to
22 May 2024
Same period 2023 Same period 2022
Rank 539 599 428
Rank change year-on-year +60 -171 +59
Permanent jobs citing Publishing 224 163 519
As % of all permanent jobs advertised in the UK excluding London 0.31% 0.28% 0.72%
As % of the General category 0.55% 0.40% 1.18%
Number of salaries quoted 126 91 228
10th Percentile £28,250 £33,730 £28,250
25th Percentile £35,529 £43,375 £41,750
Median annual salary (50th Percentile) £47,500 £60,000 £53,306
Median % change year-on-year -20.83% +12.56% -7.29%
75th Percentile £60,741 £71,700 £72,500
90th Percentile £82,500 £88,750 £81,500
UK median annual salary £45,000 £60,000 £57,500
% change year-on-year -25.00% +4.35% -

All General Skills
UK excluding London

Publishing is in the General Skills category. The following table is for comparison with the above and provides summary statistics for all permanent job vacancies advertised in the UK excluding London with a requirement for common skills.

Permanent vacancies with a requirement for common skills 40,993 40,388 44,086
As % of all permanent jobs advertised in the UK excluding London 57.08% 68.68% 60.79%
Number of salaries quoted 26,506 18,404 24,318
10th Percentile £26,000 £28,250 £28,500
25th Percentile £32,500 £37,500 £37,500
Median annual salary (50th Percentile) £47,500 £52,500 £50,000
Median % change year-on-year -9.52% +5.00% +5.26%
75th Percentile £62,500 £67,500 £65,000
90th Percentile £75,000 £81,250 £78,750
UK median annual salary £52,500 £60,000 £60,000
% change year-on-year -12.50% - +9.09%

Publishing
Job Vacancy Trend in the UK excluding London

Job postings citing Publishing as a proportion of all IT jobs advertised in the UK excluding London.
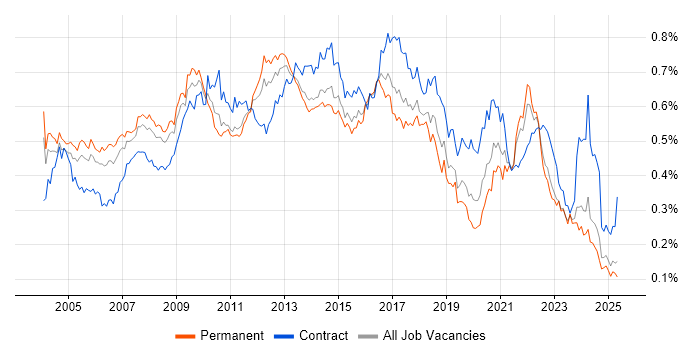
Job vacancy trend for Publishing in the UK excluding London

Publishing
Salary Trend in the UK excluding London

3-month moving average salary quoted in jobs citing Publishing in the UK excluding London.

Salary trend for Publishing in the UK excluding London

Publishing
Salary Histogram in the UK excluding London

Salary distribution for jobs citing Publishing in the UK excluding London over the 6 months to 22 May 2024.

Salary histogram for Publishing in the UK excluding London

Publishing
Job Locations in the UK excluding London

The table below looks at the demand and provides a guide to the median salaries quoted in IT jobs citing Publishing within the UK excluding London region over the 6 months to 22 May 2024. The 'Rank Change' column provides an indication of the change in demand within each location based on the same 6 month period last year.

Location Rank Change
on Same Period
Last Year
Matching
Permanent
IT Job Ads
Median Salary
Past 6 Months
Median Salary
% Change
on Same Period
Last Year
Live
Jobs
South East +19 54 £53,818 -19.97% 17
North of England +100 50 £57,965 +8.34% 16
South West +11 47 £47,500 -21.00% 3
North West +34 29 £57,965 +116.69% 13
Scotland -49 28 £30,000 -37.84% 3
Midlands +2 23 £42,500 +32.81% 15
East of England -27 22 £36,664 -24.88% 11
Yorkshire +82 13 £42,500 -25.11% 4
West Midlands +11 13 £37,550 +17.34% 10
East Midlands - 10 £55,000 - 5
North East - 8 £57,965 -
Publishing
UK

Publishing
Co-occurring Skills and Capabilities in the UK excluding London by Category

The follow tables expand on the table above by listing co-occurrences grouped by category. The same employment type, locality and period is covered with up to 20 co-occurrences shown in each of the following categories:

Application Platforms
1 36 (16.07%) SAS
2 13 (5.80%) CMS
3 10 (4.46%) SharePoint
3 10 (4.46%) WordPress
4 7 (3.13%) Apache
5 5 (2.23%) ArcGIS
6 4 (1.79%) Drupal
7 2 (0.89%) Microsoft Exchange
Applications
1 8 (3.57%) Microsoft Excel
2 6 (2.68%) Adobe Illustrator
2 6 (2.68%) InDesign
2 6 (2.68%) Photoshop
3 5 (2.23%) Adobe Creative Suite
4 4 (1.79%) Adobe XD
4 4 (1.79%) Sketch
5 3 (1.34%) Microsoft Office
Business Applications
1 2 (0.89%) Dynamics CRM
2 1 (0.45%) Primavera
2 1 (0.45%) SAP MDG
Cloud Services
1 32 (14.29%) AWS
2 30 (13.39%) Azure
3 20 (8.93%) Power Platform
4 14 (6.25%) Azure DevOps
5 9 (4.02%) Microsoft 365
6 8 (3.57%) SaaS
7 6 (2.68%) GCP
7 6 (2.68%) Serverless
8 5 (2.23%) Entra ID
8 5 (2.23%) Figma
8 5 (2.23%) Google Analytics
8 5 (2.23%) PaaS
9 4 (1.79%) AWS CloudFormation
9 4 (1.79%) npm
9 4 (1.79%) WhatsApp
10 3 (1.34%) Lucidchart
11 2 (0.89%) IaaS
11 2 (0.89%) OCI
11 2 (0.89%) OneDrive
11 2 (0.89%) Wix.com
Communications & Networking
1 7 (3.13%) DHCP
1 7 (3.13%) DNS
2 5 (2.23%) Intranet
2 5 (2.23%) TCP/IP
3 2 (0.89%) Firewall
3 2 (0.89%) LAN
3 2 (0.89%) WAN
3 2 (0.89%) Wi-Fi
4 1 (0.45%) NAS
Database & Business Intelligence
1 25 (11.16%) Data Vault
2 20 (8.93%) Power BI
3 15 (6.70%) MySQL
3 15 (6.70%) Relational Database
4 10 (4.46%) MongoDB
4 10 (4.46%) PostgreSQL
5 7 (3.13%) Elasticsearch
6 5 (2.23%) Geospatial Data
6 5 (2.23%) GIS
6 5 (2.23%) Spatial Data
6 5 (2.23%) Tableau
7 4 (1.79%) DynamoDB
7 4 (1.79%) MS Access
7 4 (1.79%) NoSQL
7 4 (1.79%) SQL Server
8 3 (1.34%) Power Query
9 2 (0.89%) Metadata
9 2 (0.89%) Tableau Desktop
9 2 (0.89%) Tableau Server
10 1 (0.45%) Semantic Layer
Development Applications
1 15 (6.70%) Maven
2 11 (4.91%) Visual Studio
3 10 (4.46%) Git
4 5 (2.23%) Postman
4 5 (2.23%) SoapUI
5 2 (0.89%) JIRA
6 1 (0.45%) Bugzilla
General
1 91 (40.63%) Social Skills
2 71 (31.70%) Finance
3 57 (25.45%) Analytical Skills
4 55 (24.55%) Banking
5 47 (20.98%) Legal
6 42 (18.75%) Marketing
7 23 (10.27%) Aerospace
8 20 (8.93%) Inclusion and Diversity
9 16 (7.14%) Law
10 15 (6.70%) Investment Banking
11 9 (4.02%) Retail
12 7 (3.13%) Automotive
12 7 (3.13%) Brand Awareness
12 7 (3.13%) Telecoms
13 5 (2.23%) Local Government
13 5 (2.23%) Pharmaceutical
14 4 (1.79%) French Language
14 4 (1.79%) German Language
14 4 (1.79%) Organisational Skills
15 3 (1.34%) Presentation Skills
Job Titles
1 67 (29.91%) Senior
2 36 (16.07%) Senior Data Warehouse Specialist
3 27 (12.05%) Developer
4 25 (11.16%) Software Engineer
5 23 (10.27%) Author
5 23 (10.27%) Technical Author
6 15 (6.70%) Analyst
7 14 (6.25%) IT Manager
8 13 (5.80%) Architect
8 13 (5.80%) Senior Manager
8 13 (5.80%) Software Developer
9 12 (5.36%) Change Manager
9 12 (5.36%) IT Change Manager
9 12 (5.36%) Senior Change Manager
9 12 (5.36%) Senior Developer
9 12 (5.36%) Senior IT Manager
10 11 (4.91%) Designer
10 11 (4.91%) Research Engineer
10 11 (4.91%) Research Software Engineer
11 10 (4.46%) Solutions Architect
Libraries, Frameworks & Software Standards
1 37 (16.52%) XML
2 22 (9.82%) React
3 16 (7.14%) .NET
3 16 (7.14%) CSS
4 15 (6.70%) Spring
4 15 (6.70%) Spring Boot
5 12 (5.36%) HTML
6 11 (4.91%) .NET Framework
7 10 (4.46%) .NET Core
7 10 (4.46%) Kafka
7 10 (4.46%) Node.js
8 9 (4.02%) Web Services
9 7 (3.13%) Apache NiFi
10 6 (2.68%) AngularJS
10 6 (2.68%) Twitter Bootstrap
10 6 (2.68%) WCF
10 6 (2.68%) WPF
10 6 (2.68%) XSD
10 6 (2.68%) XSLT
11 5 (2.23%) JSON
Miscellaneous
1 36 (16.07%) Credit Risk
2 34 (15.18%) Management Information System
3 20 (8.93%) Distributed Applications
4 16 (7.14%) Cloud Native
5 13 (5.80%) Product Ownership
6 10 (4.46%) Social Media
7 9 (4.02%) Graphic Design
8 6 (2.68%) Data Structures
8 6 (2.68%) Enterprise Software
8 6 (2.68%) Self-Motivation
9 5 (2.23%) Blog
9 5 (2.23%) FMCG
10 4 (1.79%) Mobile App
11 3 (1.34%) Video Editing
11 3 (1.34%) Virtual Team
12 2 (0.89%) Cyberattack
12 2 (0.89%) Data Protection Act
12 2 (0.89%) Photography
13 1 (0.45%) Algorithms
13 1 (0.45%) Digital Media
Operating Systems
1 20 (8.93%) Windows
2 6 (2.68%) Apple iOS
3 5 (2.23%) Windows Server
4 4 (1.79%) Android
4 4 (1.79%) Linux
5 2 (0.89%) Windows 10
Processes & Methodologies
1 63 (28.13%) Agile
2 50 (22.32%) Data Analysis
2 50 (22.32%) Risk Management
3 48 (21.43%) Analytics
4 37 (16.52%) Benchmarking
4 37 (16.52%) Economics
5 36 (16.07%) Budget Responsibility
5 36 (16.07%) Problem-Solving
5 36 (16.07%) Stress Testing
6 27 (12.05%) Impact Assessments
6 27 (12.05%) Software Engineering
7 26 (11.61%) Document Management
8 22 (9.82%) Roadmaps
9 21 (9.38%) Computer Science
9 21 (9.38%) DevOps
9 21 (9.38%) OOP
10 20 (8.93%) CRM
10 20 (8.93%) SDLC
11 19 (8.48%) Coaching
11 19 (8.48%) Prototyping
Programming Languages
1 35 (15.63%) Python
2 34 (15.18%) JavaScript
3 32 (14.29%) Java
4 26 (11.61%) SQL
5 21 (9.38%) Go
6 16 (7.14%) C#
7 15 (6.70%) Groovy
7 15 (6.70%) T-SQL
8 10 (4.46%) TypeScript
9 7 (3.13%) C
10 6 (2.68%) PHP
11 4 (1.79%) Data Analysis Expressions
12 1 (0.45%) VB.NET
Qualifications
1 47 (20.98%) Degree
2 30 (13.39%) HNC
3 25 (11.16%) HND
4 16 (7.14%) Computer Science Degree
5 15 (6.70%) Security Cleared
6 10 (4.46%) SC Cleared
7 7 (3.13%) DV Cleared
8 6 (2.68%) DBS Check
9 2 (0.89%) CompTIA Security+
10 1 (0.45%) BPSS Clearance
10 1 (0.45%) PhD
Quality Assurance & Compliance
1 36 (16.07%) IFRS
1 36 (16.07%) IFRS 9
2 11 (4.91%) QA
3 10 (4.46%) GDPR
4 6 (2.68%) ISO/IEC 27001
5 5 (2.23%) Cyber Essentials
6 3 (1.34%) Accessibility
6 3 (1.34%) Cyber Essentials PLUS
7 2 (0.89%) Data Quality
7 2 (0.89%) NCSC
7 2 (0.89%) PCI DSS
7 2 (0.89%) PMO
System Software
1 21 (9.38%) Docker
2 10 (4.46%) Active Directory
Systems Management
1 19 (8.48%) Terraform
2 14 (6.25%) Kubernetes
3 7 (3.13%) Ansible
3 7 (3.13%) Kibana
4 3 (1.34%) Microsoft Intune
5 2 (0.89%) CASB
6 1 (0.45%) Core Impact
6 1 (0.45%) Single Sign-On
6 1 (0.45%) TeamSite
Vendors
1 27 (12.05%) Microsoft
2 19 (8.48%) Adobe
2 19 (8.48%) Google
3 10 (4.46%) Apple
4 5 (2.23%) ESRI
4 5 (2.23%) Salesforce
4 5 (2.23%) Twitter
4 5 (2.23%) VMware
5 4 (1.79%) Facebook
5 4 (1.79%) Instagram
6 3 (1.34%) Marketo
7 2 (0.89%) Cadence
7 2 (0.89%) Oracle
7 2 (0.89%) TikTok
7 2 (0.89%) YouTube
8 1 (0.45%) ForgeRock
8 1 (0.45%) mParticle
8 1 (0.45%) Qubit
8 1 (0.45%) SAP