R Jobs in the UK excluding London

R
UK > UK excluding London

The table below provides summary statistics for permanent job vacancies advertised in the UK excluding London requiring R skills. It includes a benchmarking guide to the annual salaries offered in vacancies that cited R over the 6 months leading up to 12 July 2025, comparing them to the same period in the previous two years.

6 months to
12 Jul 2025
Same period 2024 Same period 2023
Rank 365 456 356
Rank change year-on-year +91 -100 -33
Permanent jobs citing R 265 321 407
As % of all permanent jobs advertised in the UK excluding London 0.61% 0.43% 0.80%
As % of the Programming Languages category 2.55% 1.46% 2.13%
Number of salaries quoted 153 228 230
10th Percentile £45,000 £28,750 £36,250
25th Percentile £51,250 £41,138 £42,500
Median annual salary (50th Percentile) £62,000 £55,000 £54,882
Median % change year-on-year +12.73% +0.22% +9.50%
75th Percentile - £70,000 £67,500
90th Percentile £80,000 £85,000 £82,797
UK median annual salary £62,000 £60,000 £65,000
% change year-on-year +3.33% -7.69% +8.96%

All Programming Languages
UK excluding London

R falls under the Programming Languages category. For comparison with the information above, the following table provides summary statistics for all permanent job vacancies requiring coding skills in the UK excluding London.

Permanent vacancies with a requirement for coding skills 10,387 22,007 19,105
As % of all permanent jobs advertised in the UK excluding London 24.10% 29.21% 37.36%
Number of salaries quoted 6,661 15,691 12,559
10th Percentile £32,500 £32,500 £35,000
25th Percentile £42,500 £41,250 £42,500
Median annual salary (50th Percentile) £55,000 £55,000 £55,000
Median % change year-on-year - - +4.76%
75th Percentile £68,000 £67,500 £70,000
90th Percentile £80,000 £80,000 £82,500
UK median annual salary £60,000 £60,000 £65,000
% change year-on-year - -7.69% +4.00%

R
Job Vacancy Trend in the UK excluding London

Job postings citing R as a proportion of all IT jobs advertised in the UK excluding London.
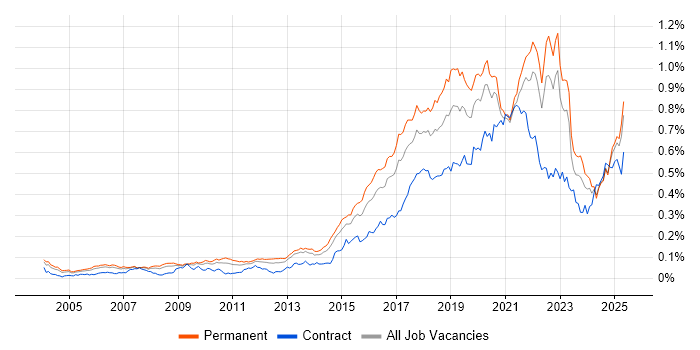
Job vacancy trend for R in the UK excluding London

R
Salary Trend in the UK excluding London

3-month moving average salary quoted in jobs citing R in the UK excluding London.

Salary trend for R in the UK excluding London

R
Salary Histogram in the UK excluding London

Salary distribution for jobs citing R in the UK excluding London over the 6 months to 12 July 2025.

Salary histogram for R in the UK excluding London

R
Job Locations in the UK excluding London

The table below looks at the demand and provides a guide to the median salaries quoted in IT jobs citing R within the UK excluding London region over the 6 months to 12 July 2025. The 'Rank Change' column provides an indication of the change in demand within each location based on the same 6 month period last year.

Location Rank Change
on Same Period
Last Year
Matching
Permanent
IT Job Ads
Median Salary
Past 6 Months
Median Salary
% Change
on Same Period
Last Year
Live
Jobs
South East +99 116 £62,000 +24.00% 127
North of England +24 47 £65,000 +31.92% 138
Midlands +64 38 £52,750 -8.27% 92
South West +86 33 £47,500 -32.14% 42
Yorkshire +55 24 £75,000 +43.85% 48
West Midlands +54 20 £53,688 -23.30% 61
East Midlands +44 18 £39,919 -11.29% 31
North West -19 18 £57,000 +20.00% 80
Scotland +65 13 £39,000 -9.72% 36
Wales +39 13 £62,000 +55.00% 23
East of England +32 11 £100,000 +35.59% 77
North East +36 5 £47,500 -3.60% 13
R
UK

R
Co-occurring Skills and Capabilities in the UK excluding London by Category

The follow tables expand on the table above by listing co-occurrences grouped by category. The same employment type, locality and period is covered with up to 20 co-occurrences shown in each of the following categories:

Application Platforms
1 20 (7.55%) SAS
2 8 (3.02%) Apache Spark
3 5 (1.89%) Apache Airflow
4 3 (1.13%) Jupyter
5 2 (0.75%) Apache
5 2 (0.75%) R Markdown
6 1 (0.38%) SharePoint
Applications
1 11 (4.15%) Microsoft Excel
2 4 (1.51%) Microsoft PowerPoint
3 2 (0.75%) Microsoft Project
3 2 (0.75%) Revit
3 2 (0.75%) SPSS
4 1 (0.38%) Spreadsheet
Cloud Services
1 46 (17.36%) Power Platform
2 43 (16.23%) Azure
3 26 (9.81%) AWS
4 18 (6.79%) GCP
5 10 (3.77%) GitHub
6 7 (2.64%) Azure Data Factory
7 5 (1.89%) AWS Lambda
7 5 (1.89%) Azure Synapse Analytics
7 5 (1.89%) Serverless
8 4 (1.51%) Azure Machine Learning
9 3 (1.13%) Azure AI
9 3 (1.13%) IBM Watson
10 2 (0.75%) Smartsheet
11 1 (0.38%) Adobe Analytics
11 1 (0.38%) Amazon EKS
11 1 (0.38%) Amazon S3
11 1 (0.38%) dbt
11 1 (0.38%) Power Automate
Communications & Networking
1 5 (1.89%) VLAN
1 5 (1.89%) VPN
2 4 (1.51%) IPv4
3 3 (1.13%) Cisco IOS
3 3 (1.13%) Cisco Wireless
3 3 (1.13%) DHCP
3 3 (1.13%) DNS
3 3 (1.13%) Firewall
3 3 (1.13%) IP Telephony
3 3 (1.13%) IPsec
3 3 (1.13%) LAN
3 3 (1.13%) MPLS
3 3 (1.13%) PuTTY
3 3 (1.13%) Spanning Tree
3 3 (1.13%) TCP/IP
3 3 (1.13%) WAN
3 3 (1.13%) Wireless
3 3 (1.13%) Wireless Security
3 3 (1.13%) Wireshark
3 3 (1.13%) WLAN
Database & Business Intelligence
1 46 (17.36%) Power BI
2 26 (9.81%) Tableau
3 10 (3.77%) SQL Server
4 9 (3.40%) Data Lake
4 9 (3.40%) NoSQL
5 7 (2.64%) Big Data
5 7 (2.64%) BigQuery
5 7 (2.64%) Data Warehouse
5 7 (2.64%) Qlik Sense
6 6 (2.26%) Hadoop
6 6 (2.26%) QlikView
6 6 (2.26%) Relational Database
7 5 (1.89%) PostgreSQL
8 4 (1.51%) BusinessObjects
8 4 (1.51%) Metadata
8 4 (1.51%) Neo4j
9 3 (1.13%) Amazon Athena
9 3 (1.13%) Impala
9 3 (1.13%) Metadata Repository
9 3 (1.13%) Spark SQL
Development Applications
1 77 (29.06%) Rational DOORS
2 17 (6.42%) Git
3 9 (3.40%) ER Studio
4 4 (1.51%) MLflow
4 4 (1.51%) Subversion
5 1 (0.38%) JIRA
5 1 (0.38%) RStudio
General
1 77 (29.06%) Electronics
2 57 (21.51%) Analytical Skills
3 53 (20.00%) Social Skills
4 38 (14.34%) Finance
5 24 (9.06%) Retail
6 14 (5.28%) Telecoms
7 12 (4.53%) Pharmaceutical
8 11 (4.15%) Banking
9 10 (3.77%) Inclusion and Diversity
10 8 (3.02%) Influencing Skills
10 8 (3.02%) Legal
11 6 (2.26%) Marketing
11 6 (2.26%) Public Sector
12 5 (1.89%) Manufacturing
13 4 (1.51%) Law
14 3 (1.13%) Aerospace
14 3 (1.13%) Investment Banking
14 3 (1.13%) Military
14 3 (1.13%) Organisational Skills
15 1 (0.38%) Aviation
Job Titles
1 111 (41.89%) Senior
2 80 (30.19%) Systems Engineer
3 77 (29.06%) Senior Systems Engineer
4 47 (17.74%) Analyst
5 21 (7.92%) Senior Analyst
6 17 (6.42%) Data Scientist
7 13 (4.91%) Data Analyst
8 11 (4.15%) Lead
9 10 (3.77%) Business Intelligence Analyst
9 10 (3.77%) Power BI Analyst
9 10 (3.77%) Senior Business Intelligence Analyst
10 9 (3.40%) Data Modeller
10 9 (3.40%) Finance Modeller
11 8 (3.02%) Analytics Manager
11 8 (3.02%) Data Analytics Manager
11 8 (3.02%) Data Engineer
11 8 (3.02%) Data Manager
12 6 (2.26%) Architect
12 6 (2.26%) SAS Modeller
12 6 (2.26%) Security Analyst
Libraries, Frameworks & Software Standards
1 52 (19.62%) HTML
2 7 (2.64%) PyTorch
2 7 (2.64%) scikit-learn
2 7 (2.64%) TensorFlow
3 6 (2.26%) Kafka
4 4 (1.51%) PySpark
4 4 (1.51%) Regular Expression
5 3 (1.13%) 802.1X
5 3 (1.13%) Apache NiFi
5 3 (1.13%) CSS
5 3 (1.13%) Keras
5 3 (1.13%) NumPy
5 3 (1.13%) Pandas
5 3 (1.13%) Plotly
5 3 (1.13%) React
5 3 (1.13%) Shiny
6 2 (0.75%) .NET
6 2 (0.75%) Tailwind CSS
7 1 (0.38%) Node.js
7 1 (0.38%) XML
Miscellaneous
1 86 (32.45%) Algorithms
2 14 (5.28%) Management Information System
3 6 (2.26%) Credit Risk
4 5 (1.89%) Biopharmaceutical
4 5 (1.89%) Data Structures
4 5 (1.89%) Legacy Systems
4 5 (1.89%) Market Risk
4 5 (1.89%) Self-Motivation
5 4 (1.51%) Distributed Systems
5 4 (1.51%) Freedom of Information
5 4 (1.51%) Hybrid Cloud
5 4 (1.51%) Product Ownership
5 4 (1.51%) Public Cloud
6 3 (1.13%) AI Agents
6 3 (1.13%) Blockchain
6 3 (1.13%) Genomics
6 3 (1.13%) Robotics
7 2 (0.75%) Molecular Biology
7 2 (0.75%) Omics
7 2 (0.75%) Onboarding
Operating Systems
1 12 (4.53%) Linux
2 6 (2.26%) Windows
3 4 (1.51%) Unix
Processes & Methodologies
1 102 (38.49%) Mentoring
2 92 (34.72%) Stakeholder Engagement
3 91 (34.34%) Machine Learning
4 80 (30.19%) Systems Engineering
5 77 (29.06%) Signal Processing
5 77 (29.06%) Technical Leadership
6 71 (26.79%) Artificial Intelligence
7 61 (23.02%) Computer Science
8 54 (20.38%) Data Privacy
9 52 (19.62%) Business Intelligence
10 51 (19.25%) Analytics
11 48 (18.11%) Data Science
12 32 (12.08%) Data Modelling
13 31 (11.70%) Visualisation
14 29 (10.94%) Agile
14 29 (10.94%) Mathematics
15 28 (10.57%) Data Analysis
15 28 (10.57%) Stakeholder Management
16 27 (10.19%) Problem-Solving
16 27 (10.19%) Statistics
Programming Languages
1 158 (59.62%) Python
2 129 (48.68%) SQL
3 60 (22.64%) Java
4 57 (21.51%) C++
5 56 (21.13%) MATLAB
6 52 (19.62%) C#
6 52 (19.62%) JavaScript
7 49 (18.49%) TypeScript
8 48 (18.11%) C
8 48 (18.11%) Dart
8 48 (18.11%) PHP
8 48 (18.11%) Ruby
8 48 (18.11%) Rust
9 11 (4.15%) Data Analysis Expressions
10 7 (2.64%) Bash
10 7 (2.64%) Julia
11 6 (2.26%) VBA
12 5 (1.89%) PowerShell
13 4 (1.51%) Perl
14 3 (1.13%) PROC SQL
Qualifications
1 94 (35.47%) Degree
2 77 (29.06%) BPSS Clearance
3 51 (19.25%) Computer Science Degree
4 14 (5.28%) DBS Check
4 14 (5.28%) Master's Degree
5 12 (4.53%) PhD
6 9 (3.40%) Security Cleared
7 7 (2.64%) AWS Certification
7 7 (2.64%) Numerate Degree
8 6 (2.26%) CISM
8 6 (2.26%) CISSP
8 6 (2.26%) CRISC
8 6 (2.26%) Postgraduate
8 6 (2.26%) SC Cleared
9 5 (1.89%) Cisco Certification
10 3 (1.13%) Azure Certification
10 3 (1.13%) CCNP
11 2 (0.75%) CCNA
12 1 (0.38%) DV Cleared
Quality Assurance & Compliance
1 77 (29.06%) ISO/IEC 15288
2 13 (4.91%) Data Quality
3 12 (4.53%) GDPR
4 9 (3.40%) Accessibility
5 6 (2.26%) ISO/IEC 27001
5 6 (2.26%) SOC 2
6 4 (1.51%) Basel II
6 4 (1.51%) Basel III
6 4 (1.51%) Dodd-Frank
6 4 (1.51%) IFRS
6 4 (1.51%) IFRS 9
6 4 (1.51%) PCI DSS
6 4 (1.51%) QA
7 1 (0.38%) CDISC
7 1 (0.38%) DICOM
7 1 (0.38%) HIPAA
7 1 (0.38%) HL7
7 1 (0.38%) PMO
7 1 (0.38%) SNOMED CT
System Software
1 8 (3.02%) Docker
2 5 (1.89%) HDFS
3 3 (1.13%) Apache Flume
Systems Management
1 5 (1.89%) Kubernetes
2 4 (1.51%) Ansible
2 4 (1.51%) Puppet
3 3 (1.13%) Kibana
3 3 (1.13%) Kubeflow
3 3 (1.13%) logstash
3 3 (1.13%) Oozie
4 2 (0.75%) Terraform
Vendors
1 80 (30.19%) IBM
2 20 (7.55%) Microsoft
3 11 (4.15%) Databricks
4 7 (2.64%) Google
5 5 (1.89%) Cisco
6 4 (1.51%) Alteryx
6 4 (1.51%) Informatica
7 3 (1.13%) Genesys
7 3 (1.13%) MicroStrategy
7 3 (1.13%) Oracle
7 3 (1.13%) Riverbed
7 3 (1.13%) SAP
7 3 (1.13%) Verint
8 2 (0.75%) Autodesk
8 2 (0.75%) Automation Anywhere
8 2 (0.75%) Meraki
9 1 (0.38%) Adobe
9 1 (0.38%) Facebook
9 1 (0.38%) Talend
9 1 (0.38%) YouTube