Customer Experience Jobs in the UK excluding London

Customer Experience (CX)
UK > UK excluding London

The table below provides summary statistics for permanent job vacancies advertised in the UK excluding London requiring Customer Experience skills. It includes a benchmarking guide to the annual salaries offered in vacancies that cited Customer Experience over the 6 months leading up to 13 June 2025, comparing them to the same period in the previous two years.

6 months to
13 Jun 2025
Same period 2024 Same period 2023
Rank 114 139 107
Rank change year-on-year +25 -32 -6
Permanent jobs citing Customer Experience 1,054 1,530 1,752
As % of all permanent jobs advertised in the UK excluding London 2.66% 1.91% 3.17%
As % of the Processes & Methodologies category 2.91% 2.36% 3.32%
Number of salaries quoted 502 900 780
10th Percentile £24,000 £25,000 £26,250
25th Percentile £25,750 £31,250 £38,750
Median annual salary (50th Percentile) £32,851 £40,000 £52,000
Median % change year-on-year -17.87% -23.08% -5.45%
75th Percentile £47,500 £58,750 £75,000
90th Percentile £76,125 £81,250 £83,750
UK median annual salary £32,951 £45,000 £60,249
% change year-on-year -26.78% -25.31% +0.42%

All Process and Methodology Skills
UK excluding London

Customer Experience falls under the Processes and Methodologies category. For comparison with the information above, the following table provides summary statistics for all permanent job vacancies requiring process or methodology skills in the UK excluding London.

Permanent vacancies with a requirement for process or methodology skills 36,204 64,705 52,764
As % of all permanent jobs advertised in the UK excluding London 91.36% 80.78% 95.49%
Number of salaries quoted 17,609 43,767 28,368
10th Percentile £26,000 £27,500 £30,500
25th Percentile £35,000 £36,250 £40,000
Median annual salary (50th Percentile) £50,055 £50,000 £55,000
Median % change year-on-year +0.11% -9.09% +4.76%
75th Percentile £65,000 £65,000 £70,000
90th Percentile £77,500 £77,500 £82,500
UK median annual salary £56,000 £55,000 £60,899
% change year-on-year +1.82% -9.69% +1.50%

Customer Experience
Job Vacancy Trend in the UK excluding London

Job postings citing Customer Experience as a proportion of all IT jobs advertised in the UK excluding London.
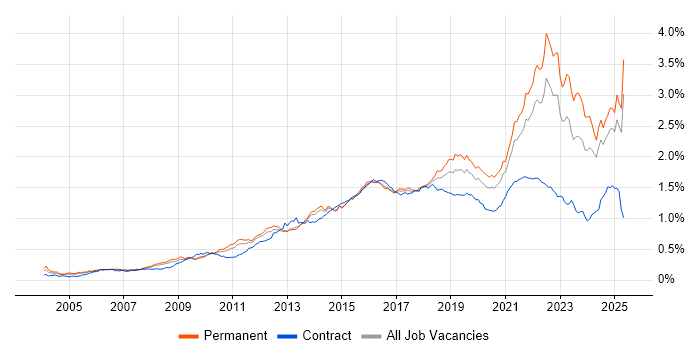
Job vacancy trend for Customer Experience in the UK excluding London

Customer Experience
Salary Trend in the UK excluding London

3-month moving average salary quoted in jobs citing Customer Experience in the UK excluding London.

Salary trend for Customer Experience in the UK excluding London

Customer Experience
Salary Histogram in the UK excluding London

Salary distribution for jobs citing Customer Experience in the UK excluding London over the 6 months to 13 June 2025.

Salary histogram for Customer Experience in the UK excluding London

Customer Experience
Job Locations in the UK excluding London

The table below looks at the demand and provides a guide to the median salaries quoted in IT jobs citing Customer Experience within the UK excluding London region over the 6 months to 13 June 2025. The 'Rank Change' column provides an indication of the change in demand within each location based on the same 6 month period last year.

Location Rank Change
on Same Period
Last Year
Matching
Permanent
IT Job Ads
Median Salary
Past 6 Months
Median Salary
% Change
on Same Period
Last Year
Live
Jobs
Scotland +165 301 £32,851 -45.25% 74
South East +8 237 £25,500 -32.89% 560
North of England -55 159 £35,500 -17.44% 311
South West +113 147 £35,000 -22.22% 98
East of England +64 103 £32,500 -31.58% 106
North West -58 96 £35,250 -6.00% 174
Midlands -88 88 £38,750 -10.92% 198
East Midlands +4 51 £32,500 -27.78% 94
Yorkshire -22 38 £40,000 -9.09% 106
West Midlands -100 36 £45,000 +12.50% 101
North East +37 25 £32,851 -34.30% 35
Wales -3 21 £32,851 -12.40% 33
Northern Ireland +3 7 £32,851 -6.14% 33
Customer Experience
UK

Customer Experience
Co-occurring Skills and Capabilities in the UK excluding London by Category

The follow tables expand on the table above by listing co-occurrences grouped by category. The same employment type, locality and period is covered with up to 20 co-occurrences shown in each of the following categories:

Application Platforms
1 75 (7.12%) Oracle Application Server
2 12 (1.14%) CMS
2 12 (1.14%) Microsoft Exchange
3 11 (1.04%) Confluence
3 11 (1.04%) SharePoint
4 7 (0.66%) IBM Domino
5 4 (0.38%) Adobe Experience Manager
6 3 (0.28%) Apache Spark
7 2 (0.19%) JOnAS
7 2 (0.19%) NetWeaver
7 2 (0.19%) Oracle SOA Suite
7 2 (0.19%) Sitecore CMS
7 2 (0.19%) WebLogic
8 1 (0.095%) Apache
8 1 (0.095%) Apache Airflow
8 1 (0.095%) CICS
8 1 (0.095%) Oracle Workflow
8 1 (0.095%) Umbraco
Applications
1 99 (9.39%) Microsoft Office
2 74 (7.02%) Microsoft Excel
3 24 (2.28%) Microsoft PowerPoint
4 4 (0.38%) Adobe Creative Suite
4 4 (0.38%) Adobe Illustrator
4 4 (0.38%) Photoshop
5 3 (0.28%) Adobe After Effects
5 3 (0.28%) Chatbot
5 3 (0.28%) InDesign
5 3 (0.28%) Microsoft Project
5 3 (0.28%) Spreadsheet
6 2 (0.19%) Adobe Premiere
7 1 (0.095%) Adobe XD
7 1 (0.095%) Maya
7 1 (0.095%) Sketch
Business Applications
1 16 (1.52%) OpenText VIM for SAP
1 16 (1.52%) SAP FI
2 4 (0.38%) Dynamics CRM
3 3 (0.28%) Oracle BPM
4 2 (0.19%) Magento
4 2 (0.19%) Shopify
5 1 (0.095%) NetSuite
5 1 (0.095%) SAP BPC
5 1 (0.095%) Sprinklr
Cloud Services
1 67 (6.36%) Azure
2 48 (4.55%) Power Platform
3 45 (4.27%) Microsoft 365
4 29 (2.75%) SaaS
5 26 (2.47%) AWS
6 20 (1.90%) GCP
7 18 (1.71%) Google Analytics
8 17 (1.61%) Entra ID
9 12 (1.14%) Adobe Analytics
10 8 (0.76%) Serverless
11 7 (0.66%) Azure Data Factory
11 7 (0.66%) OpenShift
12 6 (0.57%) Azure Synapse Analytics
12 6 (0.57%) Dynamics 365
13 5 (0.47%) Amazon EKS
13 5 (0.47%) Contentsquare
13 5 (0.47%) Figma
13 5 (0.47%) PowerApps
14 4 (0.38%) Google Workspace
15 3 (0.28%) GitHub
Communications & Networking
1 44 (4.17%) 5G
2 41 (3.89%) 4G
3 15 (1.42%) WAN
4 13 (1.23%) VPN
5 11 (1.04%) Firewall
6 10 (0.95%) Cisco IOS
6 10 (0.95%) LAN
7 9 (0.85%) Internet
8 8 (0.76%) DNS
9 7 (0.66%) Unified Communications
10 6 (0.57%) MPLS
10 6 (0.57%) VoIP
11 5 (0.47%) Broadband
11 5 (0.47%) TCP/IP
12 4 (0.38%) Network Security
12 4 (0.38%) Software-Defined Networking
13 3 (0.28%) BGP
13 3 (0.28%) NX-OS
13 3 (0.28%) OSPF
13 3 (0.28%) VXLAN
Database & Business Intelligence
1 84 (7.97%) Data Warehouse
2 75 (7.12%) Enterprise Data Warehouse
2 75 (7.12%) Oracle Reports
3 48 (4.55%) Power BI
4 18 (1.71%) BusinessObjects
4 18 (1.71%) Data Mining
5 14 (1.33%) SQL Server
6 6 (0.57%) Relational Database
7 5 (0.47%) SQL Server Integration Services
8 4 (0.38%) Tableau
9 3 (0.28%) Oracle Database
9 3 (0.28%) Oracle Database 11g
9 3 (0.28%) Oracle Database 12c
9 3 (0.28%) PostgreSQL
10 2 (0.19%) BigQuery
10 2 (0.19%) MySQL
10 2 (0.19%) NoSQL
10 2 (0.19%) SAP HANA
11 1 (0.095%) DB2
11 1 (0.095%) DTS
Development Applications
1 25 (2.37%) JIRA
2 12 (1.14%) Jenkins
3 9 (0.85%) Git
4 7 (0.66%) GitLab
5 5 (0.47%) Visual Studio
6 4 (0.38%) webpack
7 3 (0.28%) Xcode
7 3 (0.28%) XCTest
7 3 (0.28%) XCUITest
8 2 (0.19%) JDeveloper
9 1 (0.095%) Bitbucket
9 1 (0.095%) Selenium
General
1 475 (45.07%) Finance
2 433 (41.08%) Social Skills
3 319 (30.27%) Retail
4 217 (20.59%) Analytical Skills
5 103 (9.77%) Marketing
6 86 (8.16%) Organisational Skills
7 77 (7.31%) Military
8 68 (6.45%) Banking
9 54 (5.12%) Telecoms
10 39 (3.70%) Law
11 36 (3.42%) Inclusion and Diversity
12 31 (2.94%) Manufacturing
13 28 (2.66%) Electronics
14 21 (1.99%) Games
15 20 (1.90%) Influencing Skills
15 20 (1.90%) Presentation Skills
16 19 (1.80%) Advertising
17 17 (1.61%) Back Office
18 16 (1.52%) Financial Institution
19 14 (1.33%) Legal
Job Titles
1 78 (7.40%) Analyst
1 78 (7.40%) Sales Executive
2 64 (6.07%) Account Executive
3 57 (5.41%) Senior
4 54 (5.12%) Developer
5 52 (4.93%) Junior
6 49 (4.65%) Graduate
6 49 (4.65%) Technical Support
7 46 (4.36%) Graduate Sales Executive
8 39 (3.70%) Support Technician
9 37 (3.51%) Lead
10 32 (3.04%) Innovation Manager
11 30 (2.85%) Corporate Sales Executive
12 29 (2.75%) Support Engineer
13 26 (2.47%) Senior Analyst
14 25 (2.37%) Database Engineer
15 24 (2.28%) Architect
16 22 (2.09%) Service Analyst
17 21 (1.99%) Product Manager
18 20 (1.90%) Junior Developer
Libraries, Frameworks & Software Standards
1 14 (1.33%) Spring Boot
2 13 (1.23%) CSS
2 13 (1.23%) HTML
2 13 (1.23%) REST
3 12 (1.14%) React
4 11 (1.04%) Spring
5 10 (0.95%) .NET
6 9 (0.85%) Lightning Web Components
6 9 (0.85%) RESTful
7 7 (0.66%) Middleware
7 7 (0.66%) Redux
8 6 (0.57%) .NET Core
9 5 (0.47%) Kafka
9 5 (0.47%) Laravel
9 5 (0.47%) RabbitMQ
9 5 (0.47%) SOAP
10 4 (0.38%) AngularJS
10 4 (0.38%) ASP.NET
10 4 (0.38%) Oracle Fusion
10 4 (0.38%) Symfony
Miscellaneous
1 54 (5.12%) Data Centre
2 46 (4.36%) Self-Motivation
3 42 (3.98%) Product Ownership
4 27 (2.56%) Management Information System
5 25 (2.37%) Onboarding
6 18 (1.71%) Data Structures
7 16 (1.52%) Private Cloud
8 14 (1.33%) Driving Licence
9 11 (1.04%) Analytical Mindset
9 11 (1.04%) Public Cloud
10 10 (0.95%) Social Media
11 9 (0.85%) Renewable Energy
12 8 (0.76%) Mobile App
12 8 (0.76%) Replication
13 7 (0.66%) Marketing Technology
14 6 (0.57%) e-Learning
15 5 (0.47%) Virtual Team
16 4 (0.38%) Data Protection Act
16 4 (0.38%) IoT
16 4 (0.38%) SWIFT Messaging Network
Operating Systems
1 53 (5.03%) Windows
2 22 (2.09%) Windows 10
3 11 (1.04%) Android
4 10 (0.95%) Windows Server
5 9 (0.85%) Mac OS
6 7 (0.66%) Linux
7 4 (0.38%) Apple iOS
8 2 (0.19%) VMS
8 2 (0.19%) Windows 7
9 1 (0.095%) AIX
9 1 (0.095%) Solaris
9 1 (0.095%) Windows Server 2012
9 1 (0.095%) Windows Server 2016
9 1 (0.095%) Windows Server 2019
Processes & Methodologies
1 485 (46.02%) Customer Service
2 320 (30.36%) Coaching
3 192 (18.22%) Analytics
4 181 (17.17%) Agile
5 148 (14.04%) Artificial Intelligence
6 141 (13.38%) ITIL
7 133 (12.62%) Problem-Solving
8 129 (12.24%) Continuous Improvement
9 123 (11.67%) DevOps
10 113 (10.72%) Service Management
11 104 (9.87%) Stakeholder Management
12 102 (9.68%) Decision-Making
13 97 (9.20%) Data Management
14 87 (8.25%) Data Modelling
15 83 (7.87%) Data Integration
16 82 (7.78%) Business Analysis
17 79 (7.50%) Service Delivery
18 74 (7.02%) Business Development
19 69 (6.55%) Cybersecurity
20 65 (6.17%) Business Enablement
Programming Languages
1 62 (5.88%) SQL
2 25 (2.37%) JavaScript
3 20 (1.90%) Java
3 20 (1.90%) VBA
4 19 (1.80%) Python
5 11 (1.04%) C#
6 9 (0.85%) Apex Code
7 8 (0.76%) R
8 5 (0.47%) Bash
8 5 (0.47%) C++
8 5 (0.47%) PHP
9 3 (0.28%) Swift
10 2 (0.19%) ABAP
10 2 (0.19%) PL/SQL
11 1 (0.095%) Dart
11 1 (0.095%) Data Analysis Expressions
11 1 (0.095%) PowerShell
11 1 (0.095%) Ruby
11 1 (0.095%) Scala
11 1 (0.095%) TypeScript
Qualifications
1 106 (10.06%) Degree
2 98 (9.30%) DBS Check
3 24 (2.28%) Security Cleared
4 23 (2.18%) NVQ Level 4
5 21 (1.99%) SC Cleared
6 16 (1.52%) CTC Cleared
7 9 (0.85%) Master's Degree
8 8 (0.76%) A+ Certification
9 7 (0.66%) Microsoft Certification
10 6 (0.57%) Azure Certification
11 5 (0.47%) HNC
11 5 (0.47%) MCSA
11 5 (0.47%) MCSE
12 4 (0.38%) CCNA
12 4 (0.38%) Cisco Certification
12 4 (0.38%) Computer Science Degree
12 4 (0.38%) ITIL Certification
13 3 (0.28%) ITIL Foundation Certificate
13 3 (0.28%) MOS
14 2 (0.19%) CITP
Quality Assurance & Compliance
1 44 (4.17%) SLA
2 21 (1.99%) Accessibility
3 10 (0.95%) GDPR
3 10 (0.95%) QA
4 9 (0.85%) Data Quality
5 3 (0.28%) PCI DSS
6 2 (0.19%) Cyber Essentials
6 2 (0.19%) ISO/IEC 27001
7 1 (0.095%) COBIT
7 1 (0.095%) COSHH
7 1 (0.095%) GRC
7 1 (0.095%) PMO
7 1 (0.095%) SOC 2
System Software
1 16 (1.52%) Active Directory
2 13 (1.23%) Docker
3 9 (0.85%) Hyper-V
4 7 (0.66%) VMware Infrastructure
5 1 (0.095%) BitLocker
5 1 (0.095%) VMware NSX
Systems Management
1 33 (3.13%) Kubernetes
2 13 (1.23%) Terraform
3 6 (0.57%) Proxmox
4 4 (0.38%) Argo
5 3 (0.28%) Ansible
6 2 (0.19%) Graylog
6 2 (0.19%) Microsoft Intune
7 1 (0.095%) FortiGate
7 1 (0.095%) Grafana
7 1 (0.095%) SCCM
7 1 (0.095%) Systems Management Server (SMS)
Vendors
1 228 (21.63%) BT
2 188 (17.84%) Microsoft
3 79 (7.50%) Oracle
4 71 (6.74%) Cisco
5 39 (3.70%) Google
6 34 (3.23%) Dell
6 34 (3.23%) YouTube
7 25 (2.37%) Adobe
7 25 (2.37%) Salesforce
8 21 (1.99%) Facebook
9 20 (1.90%) SAP
9 20 (1.90%) ServiceNow
10 9 (0.85%) VMware
11 8 (0.76%) Genesys
12 7 (0.66%) Palo Alto
13 4 (0.38%) Citrix
13 4 (0.38%) Tealium
14 3 (0.28%) Apple
14 3 (0.28%) Avaya
14 3 (0.28%) Verint