Publishing Jobs

Publishing
UK

The table below looks at the prevalence of the term Publishing in permanent job vacancies. Included is a benchmarking guide to the salaries offered in vacancies that cited Publishing over the 6 months leading up to 16 September 2024, comparing them to the same period in the previous two years.

6 months to
16 Sep 2024
Same period 2023 Same period 2022
Rank 580 534 398
Rank change year-on-year -46 -136 +59
Permanent jobs citing Publishing 266 284 1,389
As % of all permanent jobs advertised in the UK 0.32% 0.44% 0.90%
As % of the General category 0.56% 0.66% 1.32%
Number of salaries quoted 151 217 548
10th Percentile £33,213 £36,645 £35,000
25th Percentile £36,875 £45,000 £42,500
Median annual salary (50th Percentile) £55,000 £60,000 £55,197
Median % change year-on-year -8.33% +8.70% -8.01%
75th Percentile £68,750 £83,750 £73,750
90th Percentile £92,500 £97,283 £88,750
UK excluding London median annual salary £54,000 £63,000 £55,000
% change year-on-year -14.29% +14.55% +4.76%

All General Skills
UK

Publishing falls under the General Skills category. For comparison with the information above, the following table provides summary statistics for all permanent job vacancies requiring common skills.

Permanent vacancies with a requirement for common skills 47,280 42,960 104,872
As % of all permanent jobs advertised in the UK 57.26% 66.37% 67.88%
Number of salaries quoted 23,191 28,893 52,979
10th Percentile £30,750 £31,502 £32,500
25th Percentile £40,988 £42,500 £43,750
Median annual salary (50th Percentile) £55,000 £60,000 £60,000
Median % change year-on-year -8.33% - +4.35%
75th Percentile £77,500 £80,070 £80,000
90th Percentile £98,474 £100,000 £100,000
UK excluding London median annual salary £50,000 £50,985 £50,500
% change year-on-year -1.93% +0.96% +6.32%

Publishing
Job Vacancy Trend

Job postings citing Publishing as a proportion of all IT jobs advertised.
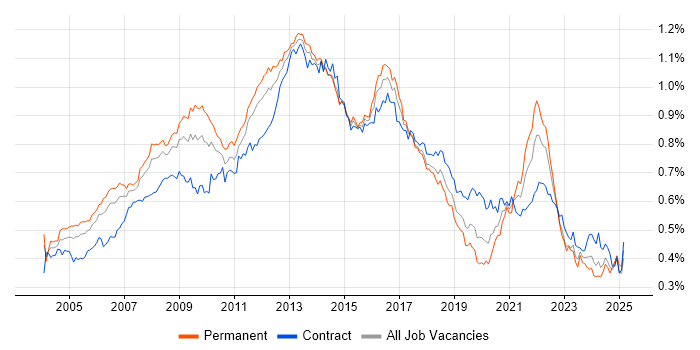
Job vacancy trend for Publishing in the UK

Publishing
Salary Trend

3-month moving average salary quoted in jobs citing Publishing.

Salary trend for Publishing in the UK

Publishing
Salary Histogram

Salary distribution for jobs citing Publishing over the 6 months to 16 September 2024.

Salary histogram for Publishing in the UK

Publishing
Top 15 Job Locations

The table below looks at the demand and provides a guide to the median salaries quoted in IT jobs citing Publishing within the UK over the 6 months to 16 September 2024. The 'Rank Change' column provides an indication of the change in demand within each location based on the same 6 month period last year.

Location Rank Change
on Same Period
Last Year
Matching
Permanent
IT Job Ads
Median Salary
Past 6 Months
Median Salary
% Change
on Same Period
Last Year
Live
Jobs
England -29 246 £55,000 -8.71% 111
London +31 134 £60,000 - 62
UK excluding London -47 125 £54,000 -14.29% 46
Work from Home -25 88 £60,000 -0.41% 85
North of England +14 30 £48,750 -27.78% 11
East of England -28 26 £52,500 -12.50% 11
South East -68 24 £50,000 -37.50% 11
Midlands -14 17 £55,000 - 7
Scotland -35 15 £60,000 +72.61% 2
North West -15 13 £60,000 +4.35% 8
South West -17 13 £55,000 -8.71% 5
Yorkshire +40 11 £42,500 -52.78% 3
East Midlands -30 10 £55,000 -
West Midlands -16 7 £61,300 +6.61% 7
North East - 6 £46,250 -

Publishing
Co-occurring Skills and Capabilities by Category

The follow tables expand on the table above by listing co-occurrences grouped by category. The same employment type, locality and period is covered with up to 20 co-occurrences shown in each of the following categories:

Application Platforms
1 40 (15.04%) SAS
2 21 (7.89%) WordPress
3 8 (3.01%) CMS
4 6 (2.26%) Apache
5 5 (1.88%) ArcGIS
5 5 (1.88%) SharePoint
6 3 (1.13%) Confluence
6 3 (1.13%) Drupal
7 2 (0.75%) Oracle Collaboration Suite
8 1 (0.38%) Kentico
8 1 (0.38%) Microsoft Exchange
8 1 (0.38%) OpenStack
Applications
1 9 (3.38%) Microsoft Excel
2 3 (1.13%) Microsoft PowerPoint
2 3 (1.13%) Spreadsheet
3 2 (0.75%) InDesign
3 2 (0.75%) Microsoft Office
3 2 (0.75%) MS Visio
3 2 (0.75%) Photoshop
4 1 (0.38%) Adobe Creative Suite
4 1 (0.38%) Adobe Illustrator
4 1 (0.38%) AutoCAD
4 1 (0.38%) MadCap Flare
Business Applications
1 12 (4.51%) Aladdin
2 6 (2.26%) Dynamics CRM
3 3 (1.13%) IBM Planning Analytics
4 2 (0.75%) Adobe Campaign
5 1 (0.38%) Teamcenter
Cloud Services
1 50 (18.80%) AWS
2 29 (10.90%) Azure
3 25 (9.40%) Serverless
4 14 (5.26%) Amazon S3
5 12 (4.51%) Amazon SQS
5 12 (4.51%) AWS Lambda
6 11 (4.14%) Microsoft 365
7 10 (3.76%) Azure Synapse Analytics
8 9 (3.38%) Power Platform
9 7 (2.63%) TestFlight
10 5 (1.88%) Lucidchart
10 5 (1.88%) npm
11 4 (1.50%) AWS CloudFormation
11 4 (1.50%) Azure Cosmos DB
11 4 (1.50%) GitHub
11 4 (1.50%) Google Analytics
12 3 (1.13%) Azure Data Factory
12 3 (1.13%) Azure Functions
12 3 (1.13%) GCP
12 3 (1.13%) SaaS
Communications & Networking
1 19 (7.14%) Intranet
2 4 (1.50%) Firewall
3 3 (1.13%) Wireless
4 2 (0.75%) LAN
4 2 (0.75%) WAN
5 1 (0.38%) Cisco ASA
5 1 (0.38%) Cisco IPT
5 1 (0.38%) Cisco Nexus
5 1 (0.38%) Cisco Wireless
5 1 (0.38%) DHCP
5 1 (0.38%) DMVPN
5 1 (0.38%) DNS
5 1 (0.38%) NAS
5 1 (0.38%) Network Security
5 1 (0.38%) SAN
5 1 (0.38%) SD-WAN
5 1 (0.38%) VLAN
5 1 (0.38%) VPN
5 1 (0.38%) VXLAN
5 1 (0.38%) Wi-Fi
Database & Business Intelligence
1 11 (4.14%) Data Lake
1 11 (4.14%) MySQL
2 10 (3.76%) Relational Database
3 9 (3.38%) Power BI
4 8 (3.01%) Elasticsearch
5 7 (2.63%) Metadata
5 7 (2.63%) SQL Server
5 7 (2.63%) SQLite
6 6 (2.26%) DynamoDB
6 6 (2.26%) GIS
6 6 (2.26%) NoSQL
7 5 (1.88%) Data Warehouse
8 3 (1.13%) Data Mining
8 3 (1.13%) Spatial Data
9 2 (0.75%) Amazon Redshift
9 2 (0.75%) Azure SQL Database
9 2 (0.75%) Geospatial Data
9 2 (0.75%) Looker
9 2 (0.75%) MongoDB
9 2 (0.75%) MS Access
Development Applications
1 18 (6.77%) Git
1 18 (6.77%) Maven
2 12 (4.51%) GitLab
3 9 (3.38%) JIRA
4 7 (2.63%) CocoaPods
5 5 (1.88%) webpack
6 2 (0.75%) Bitbucket
6 2 (0.75%) PowerBuilder
7 1 (0.38%) Ant
7 1 (0.38%) Cypress.io
7 1 (0.38%) Jenkins
7 1 (0.38%) Postman
7 1 (0.38%) SoapUI
7 1 (0.38%) Visual Studio
7 1 (0.38%) Xcode
General
1 114 (42.86%) Social Skills
2 73 (27.44%) Finance
3 63 (23.68%) Banking
4 52 (19.55%) Legal
5 51 (19.17%) Analytical Skills
6 22 (8.27%) Investment Banking
7 20 (7.52%) Marketing
8 19 (7.14%) Retail
9 18 (6.77%) Games
9 18 (6.77%) iGaming
10 15 (5.64%) Automotive
11 13 (4.89%) Inclusion and Diversity
12 12 (4.51%) Front Office
12 12 (4.51%) Tech for Good
13 11 (4.14%) Law
14 6 (2.26%) Documentation Skills
15 5 (1.88%) Multimedia
15 5 (1.88%) Public Sector
16 4 (1.50%) Back Office
16 4 (1.50%) Telecoms
Job Titles
1 78 (29.32%) Senior
2 40 (15.04%) Senior Data Warehouse Specialist
3 28 (10.53%) Developer
4 25 (9.40%) Analyst
4 25 (9.40%) Software Engineer
5 23 (8.65%) Lead
6 21 (7.89%) Web Manager
7 19 (7.14%) Business Analyst
8 18 (6.77%) Website Manager
9 16 (6.02%) Architect
10 13 (4.89%) Business Manager
11 12 (4.51%) Delivery Manager
11 12 (4.51%) Fixed Income Business Analyst
11 12 (4.51%) Lead Business Analyst
12 11 (4.14%) Consultant
12 11 (4.14%) Software Developer
12 11 (4.14%) Technical Delivery Manager
12 11 (4.14%) Technical Manager
13 10 (3.76%) Data Engineer
13 10 (3.76%) Research Engineer
Libraries, Frameworks & Software Standards
1 20 (7.52%) React
2 19 (7.14%) RESTful
3 18 (6.77%) Spring
4 15 (5.64%) Spring Boot
5 11 (4.14%) Web Services
6 10 (3.76%) REST
6 10 (3.76%) XML
7 9 (3.38%) HTML
7 9 (3.38%) JSON
7 9 (3.38%) PySpark
8 7 (2.63%) Android Jetpack
8 7 (2.63%) Jetpack Compose
8 7 (2.63%) Node.js
8 7 (2.63%) SwiftUI
9 6 (2.26%) .NET
9 6 (2.26%) .NET Core
9 6 (2.26%) Apache NiFi
9 6 (2.26%) CSS
9 6 (2.26%) Jest
9 6 (2.26%) PyTorch
Miscellaneous
1 40 (15.04%) Credit Risk
2 18 (6.77%) Mobile Games
2 18 (6.77%) Product Ownership
2 18 (6.77%) Sports Betting
3 15 (5.64%) FMCG
3 15 (5.64%) Mobile App
4 12 (4.51%) Derivative
4 12 (4.51%) Equities
4 12 (4.51%) Fixed Income
4 12 (4.51%) Foreign Exchange (FX)
4 12 (4.51%) Hedge funds
5 11 (4.14%) Cloud Native
5 11 (4.14%) Distributed Applications
6 8 (3.01%) Online Games
6 8 (3.01%) Social Media
7 7 (2.63%) Data Centre
7 7 (2.63%) Virtual Team
8 5 (1.88%) Enterprise Software
8 5 (1.88%) Graphic Design
8 5 (1.88%) Management Information System
Operating Systems
1 11 (4.14%) Linux
2 9 (3.38%) Android
2 9 (3.38%) Apple iOS
3 8 (3.01%) Windows
4 5 (1.88%) Windows 10
5 3 (1.13%) Windows Server
6 2 (0.75%) Unix
7 1 (0.38%) Mac OS
Processes & Methodologies
1 68 (25.56%) Analytics
2 66 (24.81%) Agile
3 43 (16.17%) Data Analysis
4 42 (15.79%) Risk Management
5 40 (15.04%) Benchmarking
5 40 (15.04%) Budget Responsibility
5 40 (15.04%) Economics
5 40 (15.04%) Stress Testing
6 30 (11.28%) Problem-Solving
7 29 (10.90%) Software Engineering
8 26 (9.77%) Roadmaps
9 23 (8.65%) Artificial Intelligence
9 23 (8.65%) Scrum
10 21 (7.89%) Project Management
10 21 (7.89%) TDD
11 20 (7.52%) Business Intelligence
11 20 (7.52%) Full-Stack Development
12 19 (7.14%) Machine Learning
13 18 (6.77%) Logistics
14 17 (6.39%) Mentoring
Programming Languages
1 59 (22.18%) Python
2 50 (18.80%) SQL
3 31 (11.65%) JavaScript
4 30 (11.28%) Java
5 16 (6.02%) TypeScript
6 14 (5.26%) Go
7 10 (3.76%) C#
7 10 (3.76%) Groovy
7 10 (3.76%) T-SQL
8 8 (3.01%) Objective-C
9 7 (2.63%) Swift
10 6 (2.26%) XQuery
11 4 (1.50%) PowerShell
12 3 (1.13%) Data Analysis Expressions
13 2 (0.75%) PL/SQL
13 2 (0.75%) XPath
14 1 (0.38%) Bash
14 1 (0.38%) VB.NET
Qualifications
1 20 (7.52%) Degree
2 7 (2.63%) SC Cleared
2 7 (2.63%) Security Cleared
3 4 (1.50%) Computer Science Degree
3 4 (1.50%) DBS Check
4 2 (0.75%) CBAP
4 2 (0.75%) CCAB
5 1 (0.38%) BPSS Clearance
5 1 (0.38%) CCNA
5 1 (0.38%) CCNP
5 1 (0.38%) Cisco Certification
5 1 (0.38%) HNC
5 1 (0.38%) HND
5 1 (0.38%) PMI Certification
Quality Assurance & Compliance
1 40 (15.04%) IFRS
1 40 (15.04%) IFRS 9
2 23 (8.65%) Data Quality
3 10 (3.76%) QA
4 5 (1.88%) Accessibility
5 3 (1.13%) GDPR
6 2 (0.75%) Actionable Recommendations
7 1 (0.38%) Cyber Essentials
7 1 (0.38%) Cyber Essentials PLUS
7 1 (0.38%) ISO/IEC 27001
7 1 (0.38%) NIST
7 1 (0.38%) SLA
7 1 (0.38%) WCAG
System Software
1 19 (7.14%) Docker
2 5 (1.88%) Active Directory
3 4 (1.50%) BitLocker
4 2 (0.75%) Microsoft App-V
4 2 (0.75%) XenApp
5 1 (0.38%) VMware Infrastructure
Systems Management
1 15 (5.64%) Terraform
2 12 (4.51%) Kubernetes
3 8 (3.01%) Kibana
4 6 (2.26%) Ansible
5 4 (1.50%) Grafana
5 4 (1.50%) SCCM
5 4 (1.50%) WSUS
6 2 (0.75%) Prometheus
6 2 (0.75%) ThinApp
7 1 (0.38%) Argo
7 1 (0.38%) Microsoft Intune
Vendors
1 20 (7.52%) Microsoft
2 14 (5.26%) Databricks
3 12 (4.51%) BISAM
3 12 (4.51%) Bloomberg
4 11 (4.14%) Adobe
5 7 (2.63%) Salesforce
6 6 (2.26%) Google
7 5 (1.88%) Marketo
7 5 (1.88%) Oracle
7 5 (1.88%) ServiceNow
8 4 (1.50%) ESRI
9 3 (1.13%) Cognos
9 3 (1.13%) IBM
9 3 (1.13%) VMware
10 2 (0.75%) Cisco
10 2 (0.75%) Citrix
10 2 (0.75%) SAP
10 2 (0.75%) Splunk
11 1 (0.38%) Aderant
11 1 (0.38%) Netskope