CSS Jobs in the UK excluding London

CSS (Cascading Style Sheets)
UK > UK excluding London

The following table provides summary statistics for permanent job vacancies advertised in the UK excluding London with a requirement for CSS skills. Included is a benchmarking guide to the salaries offered in vacancies that have cited CSS over the 6 months to 27 April 2024 with a comparison to the same period in the previous 2 years.

6 months to
27 Apr 2024
Same period 2023 Same period 2022
Rank 53 34 27
Rank change year-on-year -19 -7 -10
Permanent jobs citing CSS 3,212 4,335 5,898
As % of all permanent jobs advertised in the UK excluding London 4.59% 7.01% 8.35%
As % of the Libraries, Frameworks & Software Standards category 22.50% 25.27% 25.72%
Number of salaries quoted 2,190 1,950 3,531
10th Percentile £31,250 £33,750 £31,250
25th Percentile £37,500 £40,000 £37,000
Median annual salary (50th Percentile) £50,000 £52,500 £48,500
Median % change year-on-year -4.76% +8.25% +7.78%
75th Percentile £65,000 £65,000 £61,250
90th Percentile £72,500 £80,000 £70,000
UK median annual salary £52,500 £57,500 £55,000
% change year-on-year -8.70% +4.55% +10.00%

All Software Libraries and Frameworks
UK excluding London

CSS is in the Software Libraries and Frameworks category. The following table is for comparison with the above and provides summary statistics for all permanent job vacancies advertised in the UK excluding London with a requirement for technical specification, industry standards, software libraries and framework skills.

Permanent vacancies with a requirement for technical specification, industry standards, software libraries and framework skills 14,278 17,153 22,935
As % of all permanent jobs advertised in the UK excluding London 20.38% 27.76% 32.49%
Number of salaries quoted 10,244 9,453 14,553
10th Percentile £33,750 £36,356 £33,940
25th Percentile £42,500 £45,000 £42,500
Median annual salary (50th Percentile) £55,000 £57,500 £55,000
Median % change year-on-year -4.35% +4.55% +10.00%
75th Percentile £68,750 £72,500 £68,000
90th Percentile £80,001 £86,250 £81,900
UK median annual salary £60,000 £67,500 £62,500
% change year-on-year -11.11% +8.00% +13.64%

CSS
Job Vacancy Trend in the UK excluding London

Job postings citing CSS as a proportion of all IT jobs advertised in the UK excluding London.
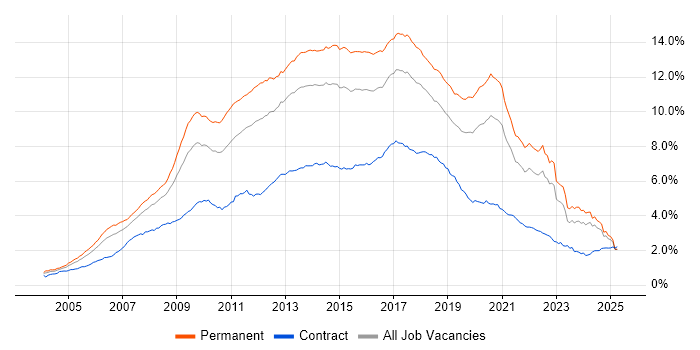
Job vacancy trend for CSS in the UK excluding London

CSS
Salary Trend in the UK excluding London

3-month moving average salary quoted in jobs citing CSS in the UK excluding London.

Salary trend for CSS in the UK excluding London

CSS
Salary Histogram in the UK excluding London

Salary distribution for jobs citing CSS in the UK excluding London over the 6 months to 27 April 2024.

Salary histogram for CSS in the UK excluding London

CSS
Job Locations in the UK excluding London

The table below looks at the demand and provides a guide to the median salaries quoted in IT jobs citing CSS within the UK excluding London region over the 6 months to 27 April 2024. The 'Rank Change' column provides an indication of the change in demand within each location based on the same 6 month period last year.

Location Rank Change
on Same Period
Last Year
Matching
Permanent
IT Job Ads
Median Salary
Past 6 Months
Median Salary
% Change
on Same Period
Last Year
Live
Jobs
North of England -16 753 £47,500 -8.65% 174
South East -18 699 £55,000 +4.76% 102
North West -16 491 £50,000 -0.47% 107
Midlands -22 454 £45,000 -18.18% 120
Scotland -10 430 £60,000 +14.29% 37
South West +21 426 £50,000 +5.26% 81
East of England 0 282 £50,000 -9.09% 63
East Midlands +5 247 £45,000 -15.09% 51
Yorkshire -15 203 £45,000 -10.00% 52
West Midlands -50 202 £47,500 -13.64% 69
Wales +13 106 £50,000 +11.11% 15
Northern Ireland +13 62 £45,000 -14.29% 8
North East -3 59 £42,500 -22.73% 15
CSS
UK

CSS
Co-occurring Skills and Capabilities in the UK excluding London by Category

The follow tables expand on the table above by listing co-occurrences grouped by category. The same employment type, locality and period is covered with up to 20 co-occurrences shown in each of the following categories:

Application Platforms
1 252 (7.85%) ArcGIS
2 244 (7.60%) GeoServer
3 210 (6.54%) WordPress
4 153 (4.76%) CMS
5 57 (1.77%) IIS
6 54 (1.68%) SharePoint
7 52 (1.62%) FileNet
8 42 (1.31%) Umbraco
9 31 (0.97%) Apache
10 30 (0.93%) Drupal
11 23 (0.72%) nginx
11 23 (0.72%) SAS
12 20 (0.62%) Confluence
13 14 (0.44%) Apache Solr
13 14 (0.44%) Cloud Foundry
14 11 (0.34%) Microsoft Exchange
15 10 (0.31%) Headless CMS
16 8 (0.25%) Sitecore CMS
17 7 (0.22%) Joomla!
18 4 (0.12%) ColdFusion
Applications
1 37 (1.15%) Photoshop
2 30 (0.93%) Adobe XD
3 28 (0.87%) Adobe Illustrator
4 25 (0.78%) Microsoft Excel
5 21 (0.65%) Adobe Creative Suite
6 18 (0.56%) Sketch
7 14 (0.44%) Microsoft Office
8 9 (0.28%) Trello
9 7 (0.22%) InVision
10 6 (0.19%) InDesign
11 4 (0.12%) Adobe After Effects
11 4 (0.12%) SPSS
12 3 (0.093%) Microsoft PowerPoint
12 3 (0.093%) Spreadsheet
12 3 (0.093%) UserZoom
13 2 (0.062%) Acrobat
13 2 (0.062%) FileZilla
14 1 (0.031%) Adobe Premiere
14 1 (0.031%) OmniGraffle
14 1 (0.031%) SketchUp
Business Applications
1 63 (1.96%) Magento
2 50 (1.56%) Shopify
3 23 (0.72%) Dynamics CRM
4 18 (0.56%) Payment Gateway
5 11 (0.34%) Salesforce CRM
6 6 (0.19%) SAP PLM
6 6 (0.19%) Teamcenter
7 5 (0.16%) NetSuite
8 4 (0.12%) Remedy ITSM
8 4 (0.12%) SDL Web 8
9 3 (0.093%) Maximo
9 3 (0.093%) Sage 200
9 3 (0.093%) SAP Business One
10 2 (0.062%) nopCommerce
11 1 (0.031%) Dynamics NAV
11 1 (0.031%) Sage 50
Cloud Services
1 1,261 (39.26%) Azure
2 704 (21.92%) AWS
3 325 (10.12%) Azure DevOps
4 213 (6.63%) IBM Cloud
5 174 (5.42%) Serverless
6 140 (4.36%) Azure Functions
7 129 (4.02%) Azure Service Bus
8 124 (3.86%) Azure Logic Apps
9 119 (3.70%) SaaS
10 110 (3.42%) GitHub
11 109 (3.39%) Azure API Management
12 84 (2.62%) Power Platform
13 75 (2.33%) Amazon S3
14 61 (1.90%) GCP
15 57 (1.77%) Figma
16 52 (1.62%) Power Automate
17 43 (1.34%) PowerApps
18 40 (1.25%) Google Analytics
19 37 (1.15%) Microsoft 365
20 31 (0.97%) Dynamics 365
Communications & Networking
1 64 (1.99%) Internet
2 54 (1.68%) TCP/IP
3 44 (1.37%) DNS
4 42 (1.31%) HTTP
5 26 (0.81%) SSL
6 23 (0.72%) LAN
6 23 (0.72%) MQTT
6 23 (0.72%) WAN
7 22 (0.68%) Firewall
8 17 (0.53%) SSH
9 13 (0.40%) Modbus
9 13 (0.40%) SNMP
10 8 (0.25%) Intranet
10 8 (0.25%) Network Security
11 6 (0.19%) Wi-Fi
12 4 (0.12%) Broadband
12 4 (0.12%) Reverse Proxy
12 4 (0.12%) SMS
12 4 (0.12%) VPN
12 4 (0.12%) Wireshark
Database & Business Intelligence
1 635 (19.77%) SQL Server
2 591 (18.40%) PostgreSQL
3 438 (13.64%) MySQL
4 383 (11.92%) NoSQL
5 290 (9.03%) MongoDB
6 270 (8.41%) GIS
7 263 (8.19%) Relational Database
8 244 (7.60%) QGIS
9 215 (6.69%) DB2
10 165 (5.14%) Azure SQL Database
11 95 (2.96%) Elasticsearch
12 55 (1.71%) Power BI
13 53 (1.65%) Apache Cassandra
14 37 (1.15%) Redis
15 23 (0.72%) Looker
16 22 (0.68%) MariaDB
17 18 (0.56%) DynamoDB
17 18 (0.56%) Geospatial Data
18 16 (0.50%) Big Data
19 15 (0.47%) Data Warehouse
Development Applications
1 638 (19.86%) Git
2 147 (4.58%) Visual Studio
3 142 (4.42%) JIRA
4 137 (4.27%) JUnit
5 123 (3.83%) Cypress.io
6 108 (3.36%) Selenium
7 91 (2.83%) Jasmine
8 76 (2.37%) Karma Test Runner
9 65 (2.02%) WebDriver
10 60 (1.87%) Protractor
11 47 (1.46%) Bitbucket
12 46 (1.43%) gulp
13 45 (1.40%) Visual Studio Code
13 45 (1.40%) webpack
14 42 (1.31%) GitLab
15 41 (1.28%) Team Foundation Server
16 38 (1.18%) Jenkins
17 26 (0.81%) Cucumber
17 26 (0.81%) PHPUnit
18 22 (0.68%) Subversion
General
1 528 (16.44%) Social Skills
2 453 (14.10%) Finance
3 402 (12.52%) Inclusion and Diversity
4 332 (10.34%) Marketing
5 280 (8.72%) Law
6 279 (8.69%) Public Sector
7 177 (5.51%) Banking
8 153 (4.76%) Retail
9 132 (4.11%) Analytical Skills
10 93 (2.90%) Investment Banking
11 83 (2.58%) Legal
12 68 (2.12%) Advertising
13 50 (1.56%) Games
14 47 (1.46%) Manufacturing
15 39 (1.21%) Telecoms
16 34 (1.06%) Organisational Skills
17 28 (0.87%) Electronics
18 23 (0.72%) Tech for Good
19 22 (0.68%) Private Banking
20 19 (0.59%) Back Office
Job Titles
1 2,068 (64.38%) Developer
2 634 (19.74%) Software Engineer
3 610 (18.99%) Senior
4 470 (14.63%) .NET Developer
5 351 (10.93%) Full Stack Developer
6 296 (9.22%) Senior Developer
7 279 (8.69%) PHP Developer
8 261 (8.13%) Software Developer
9 248 (7.72%) Lead
10 246 (7.66%) Front-End Developer (Client-Side Developer)
11 240 (7.47%) Senior Software Engineer
12 223 (6.94%) Full Stack Engineer
13 183 (5.70%) C# Developer
14 180 (5.60%) Web Developer
15 147 (4.58%) C# .NET Developer
16 144 (4.48%) Azure Developer
17 120 (3.74%) Lead Software Engineer
18 115 (3.58%) Java Engineer
19 111 (3.46%) Java Software Engineer
20 103 (3.21%) Azure Engineer
Libraries, Frameworks & Software Standards
1 2,762 (85.99%) HTML
2 1,490 (46.39%) .NET
3 1,434 (44.65%) React
4 921 (28.67%) AngularJS
5 771 (24.00%) ASP.NET
6 770 (23.97%) jQuery
7 694 (21.61%) .NET Core
8 629 (19.58%) HTML5
9 607 (18.90%) Vue
10 559 (17.40%) Twitter Bootstrap
11 539 (16.78%) Node.js
12 468 (14.57%) CSS3
13 443 (13.79%) REST
14 418 (13.01%) Web Services
15 345 (10.74%) Entity Framework
16 331 (10.31%) Laravel
17 319 (9.93%) .NET Framework
18 315 (9.81%) ASP.NET MVC
19 288 (8.97%) Blazor
20 273 (8.50%) JSON
Miscellaneous
1 305 (9.50%) Data Structures
2 303 (9.43%) Algorithms
3 214 (6.66%) Blockchain
4 213 (6.63%) Hybrid Cloud
5 115 (3.58%) Mobile App
6 111 (3.46%) Cloud Native
7 108 (3.36%) e-Learning
8 99 (3.08%) Greenfield Project
9 97 (3.02%) Self-Motivation
10 71 (2.21%) Product Ownership
11 47 (1.46%) Public Cloud
12 46 (1.43%) Legacy Systems
13 39 (1.21%) CMDB
14 37 (1.15%) Management Information System
15 35 (1.09%) Enterprise Software
16 34 (1.06%) Low-Code
17 32 (1.00%) Onboarding
18 29 (0.90%) IoT
18 29 (0.90%) Social Media
19 28 (0.87%) Virtual Team
Operating Systems
1 389 (12.11%) Linux
2 330 (10.27%) Windows
3 258 (8.03%) Android
4 250 (7.78%) Apple iOS
5 19 (0.59%) Unix
6 9 (0.28%) Mac OS
6 9 (0.28%) Ubuntu
7 8 (0.25%) Windows Server
8 4 (0.12%) AIX
8 4 (0.12%) Red Hat Enterprise Linux
9 3 (0.093%) VMS
10 2 (0.062%) Mac OS X
Processes & Methodologies
1 1,402 (43.65%) Agile
2 1,041 (32.41%) Full Stack Development
3 1,031 (32.10%) Web Development
4 819 (25.50%) MVC
5 816 (25.40%) Software Engineering
6 773 (24.07%) DevOps
7 663 (20.64%) User Experience
8 543 (16.91%) Problem-Solving
9 453 (14.10%) Front End Development
10 451 (14.04%) Artificial Intelligence
11 424 (13.20%) OOP
12 391 (12.17%) OO
13 370 (11.52%) Design Patterns
14 359 (11.18%) CI/CD
15 342 (10.65%) TDD
16 301 (9.37%) Mentoring
17 286 (8.90%) Responsive Web Design
18 280 (8.72%) SDLC
19 278 (8.66%) E-Commerce
20 275 (8.56%) SOLID
Programming Languages
1 2,719 (84.65%) JavaScript
2 1,451 (45.17%) C#
3 1,105 (34.40%) SQL
4 646 (20.11%) PHP
5 636 (19.80%) TypeScript
6 525 (16.34%) Python
7 506 (15.75%) Java
8 100 (3.11%) T-SQL
9 48 (1.49%) C++
10 38 (1.18%) VB
11 37 (1.15%) VB.NET
12 36 (1.12%) PowerShell
13 34 (1.06%) C
14 31 (0.97%) Go
14 31 (0.97%) JSX
14 31 (0.97%) Ruby
15 21 (0.65%) XAML
16 20 (0.62%) VBA
17 17 (0.53%) Objective-C
18 15 (0.47%) Swift
Qualifications
1 400 (12.45%) Degree
2 289 (9.00%) Security Cleared
3 263 (8.19%) SC Cleared
4 131 (4.08%) Computer Science Degree
5 45 (1.40%) Microsoft Certification
6 21 (0.65%) CTC Cleared
7 17 (0.53%) DBS Check
7 17 (0.53%) Master's Degree
8 8 (0.25%) Azure Certification
9 6 (0.19%) HND
10 4 (0.12%) ISEB
10 4 (0.12%) ISTQB
10 4 (0.12%) PMI Certification
11 3 (0.093%) AWS Certification
11 3 (0.093%) MCPD
12 2 (0.062%) BPSS Clearance
12 2 (0.062%) Postgraduate
13 1 (0.031%) MCP
13 1 (0.031%) Numerate Degree
Quality Assurance & Compliance
1 155 (4.83%) Accessibility
2 136 (4.23%) QA
3 47 (1.46%) WCAG
4 20 (0.62%) GDPR
4 20 (0.62%) PMO
5 17 (0.53%) WAI
6 3 (0.093%) HIPAA
6 3 (0.093%) ISO/IEC 27001
7 2 (0.062%) Cyber Essentials
7 2 (0.062%) GRC
7 2 (0.062%) HL7
7 2 (0.062%) ISO 9001
7 2 (0.062%) SLA
8 1 (0.031%) ISO 13485
8 1 (0.031%) NIST
System Software
1 204 (6.35%) Docker
2 16 (0.50%) Firmware
3 14 (0.44%) Active Directory
4 5 (0.16%) VMware Infrastructure
5 2 (0.062%) Terminal Services
5 2 (0.062%) Virtual Desktop
6 1 (0.031%) Varnish
Systems Management
1 180 (5.60%) Kubernetes
2 25 (0.78%) Terraform
3 13 (0.40%) WMI
4 10 (0.31%) MIIS
5 6 (0.19%) Single Sign-On
6 5 (0.16%) Ansible
7 4 (0.12%) cPanel
8 3 (0.093%) Galera Cluster
9 2 (0.062%) Active Directory Federation Services
9 2 (0.062%) Istio
9 2 (0.062%) Nagios
9 2 (0.062%) Plesk
9 2 (0.062%) Progress Chef
9 2 (0.062%) Puppet
10 1 (0.031%) TeamSite
Vendors
1 449 (13.98%) Microsoft
2 253 (7.88%) ESRI
3 215 (6.69%) Red Hat
4 213 (6.63%) IBM
5 157 (4.89%) Oracle
6 100 (3.11%) Adobe
7 96 (2.99%) Google
8 46 (1.43%) Facebook
8 46 (1.43%) WooCommerce
9 38 (1.18%) Salesforce
10 36 (1.12%) Atlassian
11 35 (1.09%) SAP
12 33 (1.03%) Xamarin
13 29 (0.90%) ServiceNow
14 19 (0.59%) Splunk
15 11 (0.34%) Sitecore
16 10 (0.31%) F5
17 9 (0.28%) DevExpress
17 9 (0.28%) Twitter
17 9 (0.28%) Zoho