Pharmaceutical Jobs in the UK excluding London

Pharmaceutical (Pharma)
UK > UK excluding London

The table below looks at the prevalence of the term Pharmaceutical in permanent job vacancies advertised in the UK excluding London. Included is a benchmarking guide to the salaries offered in vacancies that have cited Pharmaceutical over the 6 months to 27 April 2024 with a comparison to the same period over the previous 2 years.

6 months to
27 Apr 2024
Same period 2023 Same period 2022
Rank 298 333 253
Rank change year-on-year +35 -80 +19
Permanent jobs citing Pharmaceutical 613 571 1,005
As % of all permanent jobs advertised in the UK excluding London 0.88% 0.92% 1.42%
As % of the General category 1.52% 1.33% 2.39%
Number of salaries quoted 226 141 177
10th Percentile £29,000 £35,000 £37,000
25th Percentile £36,250 £42,500 £41,250
Median annual salary (50th Percentile) £49,500 £60,000 £55,000
Median % change year-on-year -17.50% +9.09% +10.00%
75th Percentile £63,375 £75,000 £70,000
90th Percentile £78,750 £87,500 £81,750
UK median annual salary £52,500 £65,000 £57,500
% change year-on-year -19.23% +13.04% +4.55%

All General Skills
UK excluding London

Pharmaceutical is in the General Skills category. The following table is for comparison with the above and provides summary statistics for all permanent job vacancies advertised in the UK excluding London with a requirement for common skills.

Permanent vacancies with a requirement for common skills 40,269 42,823 42,101
As % of all permanent jobs advertised in the UK excluding London 57.49% 69.30% 59.64%
Number of salaries quoted 26,334 19,314 24,106
10th Percentile £26,000 £28,500 £28,216
25th Percentile £32,500 £37,500 £37,500
Median annual salary (50th Percentile) £47,500 £52,500 £50,000
Median % change year-on-year -9.52% +5.00% +5.26%
75th Percentile £62,500 £67,500 £65,000
90th Percentile £75,750 £82,500 £78,575
UK median annual salary £52,500 £60,000 £60,000
% change year-on-year -12.50% - +9.09%

Pharmaceutical
Job Vacancy Trend in the UK excluding London

Job postings citing Pharmaceutical as a proportion of all IT jobs advertised in the UK excluding London.
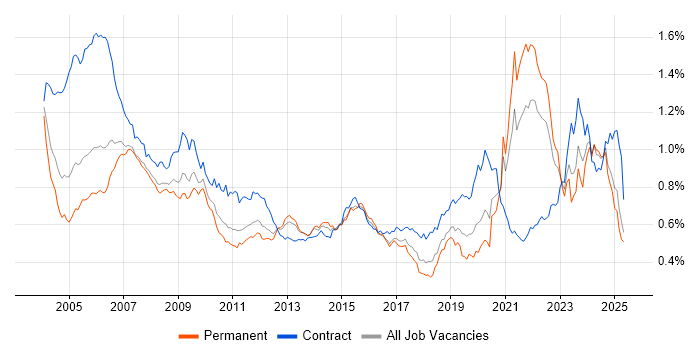
Job vacancy trend for Pharmaceutical in the UK excluding London

Pharmaceutical
Salary Trend in the UK excluding London

3-month moving average salary quoted in jobs citing Pharmaceutical in the UK excluding London.

Salary trend for Pharmaceutical in the UK excluding London

Pharmaceutical
Salary Histogram in the UK excluding London

Salary distribution for jobs citing Pharmaceutical in the UK excluding London over the 6 months to 27 April 2024.

Salary histogram for Pharmaceutical in the UK excluding London

Pharmaceutical
Job Locations in the UK excluding London

The table below looks at the demand and provides a guide to the median salaries quoted in IT jobs citing Pharmaceutical within the UK excluding London region over the 6 months to 27 April 2024. The 'Rank Change' column provides an indication of the change in demand within each location based on the same 6 month period last year.

Location Rank Change
on Same Period
Last Year
Matching
Permanent
IT Job Ads
Median Salary
Past 6 Months
Median Salary
% Change
on Same Period
Last Year
Live
Jobs
South East +49 185 £47,500 -24.00% 109
North of England +63 148 £40,000 -28.57% 162
Midlands +29 98 £60,000 +9.09% 65
East of England -36 79 £50,000 -10.71% 77
Yorkshire +59 73 £40,000 -36.00% 55
North West +51 70 £43,000 -13.13% 91
East Midlands +4 67 £48,750 -37.10% 28
South West +46 50 £47,500 +18.75% 55
West Midlands +28 31 £60,000 +14.29% 37
Northern Ireland +28 26 £50,000 +9.89% 9
Scotland -58 22 £60,000 -7.69% 36
Wales +12 5 - - 12
North East - 5 £55,000 - 24
Pharmaceutical
UK

Pharmaceutical
Co-occurring Skills and Capabilities in the UK excluding London by Category

The follow tables expand on the table above by listing co-occurrences grouped by category. The same employment type, locality and period is covered with up to 20 co-occurrences shown in each of the following categories:

Application Platforms
1 16 (2.61%) SharePoint
2 12 (1.96%) Microsoft Exchange
3 10 (1.63%) Documentum
4 9 (1.47%) SAS
5 3 (0.49%) Confluence
5 3 (0.49%) WinCC
6 2 (0.33%) CMS
7 1 (0.16%) Apache
7 1 (0.16%) IIS
7 1 (0.16%) WebSphere
Applications
1 61 (9.95%) Microsoft Excel
2 37 (6.04%) Microsoft Office
3 26 (4.24%) Microsoft PowerPoint
4 11 (1.79%) Microsoft Project
5 10 (1.63%) MS Visio
6 3 (0.49%) Spreadsheet
7 2 (0.33%) Adobe Illustrator
7 2 (0.33%) AutoCAD
7 2 (0.33%) Photoshop
7 2 (0.33%) SPSS
7 2 (0.33%) Stata
Business Applications
1 13 (2.12%) TrackWise
2 4 (0.65%) Infor CloudSuite Industrial (formerly SyteLine)
3 3 (0.49%) Q-Pulse
4 2 (0.33%) Misys Midas
5 1 (0.16%) Salesforce CRM
5 1 (0.16%) SAP Business One
5 1 (0.16%) SAP MDG
5 1 (0.16%) SAP S/4HANA
Cloud Services
1 52 (8.48%) Azure
2 39 (6.36%) Power Platform
3 31 (5.06%) Microsoft 365
4 19 (3.10%) PowerApps
5 18 (2.94%) SaaS
6 13 (2.12%) Azure DevOps
7 12 (1.96%) AWS
8 10 (1.63%) Power Automate
9 9 (1.47%) Google Analytics
9 9 (1.47%) Google Tag Manager
9 9 (1.47%) OneDrive
9 9 (1.47%) ShareGate
10 7 (1.14%) GCP
11 6 (0.98%) GitHub
12 5 (0.82%) Azure Data Factory
12 5 (0.82%) Azure Synapse Analytics
12 5 (0.82%) Cloud Computing
13 4 (0.65%) BigCommerce
14 3 (0.49%) PaaS
15 2 (0.33%) Google Workspace
Communications & Networking
1 8 (1.31%) Firewall
2 7 (1.14%) Ethernet
2 7 (1.14%) Intranet
3 6 (0.98%) TCP/IP
4 5 (0.82%) DHCP
4 5 (0.82%) DNS
4 5 (0.82%) Network Security
4 5 (0.82%) RS-232
5 4 (0.65%) Bluetooth
5 4 (0.65%) Internet
5 4 (0.65%) Wireless
6 3 (0.49%) LAN
6 3 (0.49%) SAN
6 3 (0.49%) VSAN
7 2 (0.33%) WAN
7 2 (0.33%) Wi-Fi
8 1 (0.16%) Cisco ISE
8 1 (0.16%) Intrusion Detection
8 1 (0.16%) Modbus
8 1 (0.16%) VPN
Database & Business Intelligence
1 32 (5.22%) Power BI
2 21 (3.43%) SQL Server
3 14 (2.28%) Tableau
4 9 (1.47%) MySQL
4 9 (1.47%) Relational Database
5 8 (1.31%) Big Data
5 8 (1.31%) Metadata
6 7 (1.14%) BigQuery
6 7 (1.14%) Data Lake
6 7 (1.14%) Data Warehouse
6 7 (1.14%) Looker
7 6 (0.98%) SQL Server Integration Services
8 5 (0.82%) Microsoft Analysis Services
8 5 (0.82%) SQL Server Analysis Services
9 4 (0.65%) GIS
10 3 (0.49%) Azure SQL Database
11 2 (0.33%) Electronic Patient Records
12 1 (0.16%) Amazon RDS
12 1 (0.16%) DynamoDB
12 1 (0.16%) SQLite
Development Applications
1 13 (2.12%) Git
2 11 (1.79%) JIRA
3 9 (1.47%) Postman
4 7 (1.14%) Subversion
5 6 (0.98%) Jenkins
6 5 (0.82%) JMeter
6 5 (0.82%) Newman
6 5 (0.82%) REST Assured
6 5 (0.82%) Selenium
7 4 (0.65%) Katalon Studio
7 4 (0.65%) Zephyr
8 2 (0.33%) GitLab
8 2 (0.33%) gulp
8 2 (0.33%) MSTest
8 2 (0.33%) NUnit
8 2 (0.33%) Visual Studio
9 1 (0.16%) LabVIEW
9 1 (0.16%) SQL Server Management Studio (SSMS)
9 1 (0.16%) Tricentis qTest
General
1 258 (42.09%) Manufacturing
2 253 (41.27%) Social Skills
3 121 (19.74%) Analytical Skills
4 58 (9.46%) Finance
5 55 (8.97%) Inclusion and Diversity
6 43 (7.01%) Automotive
7 42 (6.85%) Marketing
8 36 (5.87%) Legal
8 36 (5.87%) Retail
9 28 (4.57%) Aerospace
10 22 (3.59%) Electronics
10 22 (3.59%) Presentation Skills
11 13 (2.12%) Telecoms
12 12 (1.96%) Influencing Skills
12 12 (1.96%) Organisational Skills
13 9 (1.47%) Aviation
14 7 (1.14%) Banking
15 6 (0.98%) Law
16 5 (0.82%) Games
16 5 (0.82%) Publishing
Job Titles
1 86 (14.03%) Senior
2 71 (11.58%) Analyst
2 71 (11.58%) Lead
3 35 (5.71%) Project Manager
3 35 (5.71%) QA Manager
4 30 (4.89%) Senior Data Warehouse Specialist
5 26 (4.24%) QA Specialist
6 25 (4.08%) Technical Leader
7 21 (3.43%) IT Manager
7 21 (3.43%) Software Engineer
8 20 (3.26%) Developer
8 20 (3.26%) QA Leader
9 17 (2.77%) Business Manager
10 16 (2.61%) QA Officer
11 15 (2.45%) Data Scientist
11 15 (2.45%) Research Analyst
12 14 (2.28%) Business Development Manager
12 14 (2.28%) Development Manager
12 14 (2.28%) Senior Data Scientist
12 14 (2.28%) Systems Manager
Libraries, Frameworks & Software Standards
1 15 (2.45%) .NET
2 7 (1.14%) .NET Framework
3 6 (0.98%) HTML
3 6 (0.98%) Web Services
4 5 (0.82%) Swagger
4 5 (0.82%) XML
5 4 (0.65%) Gherkin
5 4 (0.65%) React
5 4 (0.65%) XSLT
5 4 (0.65%) Yocto
6 3 (0.49%) Middleware
6 3 (0.49%) Node.js
6 3 (0.49%) WPF
7 2 (0.33%) Ajax
7 2 (0.33%) ASP.NET
7 2 (0.33%) CSS
7 2 (0.33%) Entity Framework
7 2 (0.33%) jQuery
7 2 (0.33%) Razor View Engine
7 2 (0.33%) Sass
Miscellaneous
1 118 (19.25%) Management Information System
2 74 (12.07%) Life Science
3 49 (7.99%) Biopharmaceutical
4 44 (7.18%) NHS
5 26 (4.24%) Algorithms
6 21 (3.43%) FMCG
7 16 (2.61%) Self-Motivation
8 11 (1.79%) LIMS
8 11 (1.79%) Virtual Team
9 10 (1.63%) Driving Licence
9 10 (1.63%) Renewable Energy
10 9 (1.47%) Analytical Mindset
11 8 (1.31%) Data Protection Act
12 7 (1.14%) Operational Technology
13 6 (0.98%) Onboarding
13 6 (0.98%) SCADA
14 4 (0.65%) Fat Client
14 4 (0.65%) IoT
14 4 (0.65%) Public Cloud
14 4 (0.65%) Thin Client
Operating Systems
1 17 (2.77%) Windows
2 10 (1.63%) Linux
2 10 (1.63%) Windows Server
3 4 (0.65%) Embedded Linux
3 4 (0.65%) FreeRTOS
4 3 (0.49%) Windows 10
Processes & Methodologies
1 161 (26.26%) QMS
2 115 (18.76%) Validation
3 76 (12.40%) Problem-Solving
4 65 (10.60%) Mentoring
5 64 (10.44%) Project Management
6 58 (9.46%) Biotechnology
7 55 (8.97%) CAPA
8 48 (7.83%) Business Development
9 46 (7.50%) Coaching
10 45 (7.34%) Continuous Improvement
10 45 (7.34%) DevOps
11 42 (6.85%) Chemistry
12 40 (6.53%) Quality Management
13 38 (6.20%) Supplier Management
14 37 (6.04%) Business Intelligence
14 37 (6.04%) Data Analysis
15 36 (5.87%) Roadmaps
16 35 (5.71%) Line Management
17 34 (5.55%) Analytics
18 32 (5.22%) Change Control
Programming Languages
1 52 (8.48%) SQL
2 32 (5.22%) C#
3 27 (4.40%) Python
4 21 (3.43%) R
5 15 (2.45%) C
6 8 (1.31%) JavaScript
6 8 (1.31%) T-SQL
7 5 (0.82%) PowerShell
8 4 (0.65%) Bash
8 4 (0.65%) Embedded C
8 4 (0.65%) Groovy
8 4 (0.65%) Java
8 4 (0.65%) TypeScript
9 2 (0.33%) JSX
9 2 (0.33%) PHP
9 2 (0.33%) VB
10 1 (0.16%) VBA
Qualifications
1 224 (36.54%) Degree
2 46 (7.50%) Master's Degree
3 30 (4.89%) PhD
4 22 (3.59%) DBS Check
5 20 (3.26%) CIPD
6 11 (1.79%) MBA
6 11 (1.79%) NVQ Level 3
7 10 (1.63%) CFA
7 10 (1.63%) CIMA
8 9 (1.47%) ITIL Certification
8 9 (1.47%) Microsoft Certification
9 8 (1.31%) Computer Science Degree
10 7 (1.14%) Azure Certification
11 5 (0.82%) A+ Certification
11 5 (0.82%) CISSP
11 5 (0.82%) HNC
12 4 (0.65%) CISA
12 4 (0.65%) PMI Certification
12 4 (0.65%) PMP
13 3 (0.49%) CISM
Quality Assurance & Compliance
1 216 (35.24%) QA
2 191 (31.16%) GMP
3 30 (4.89%) GxP
4 25 (4.08%) Good Clinical Practice
5 24 (3.92%) GLP
6 17 (2.77%) ISO 13485
7 15 (2.45%) GDPR
8 14 (2.28%) ISO 9001
9 13 (2.12%) Sarbanes-Oxley
10 11 (1.79%) Data Quality
10 11 (1.79%) ISO/IEC 17025
11 5 (0.82%) GAMP
11 5 (0.82%) ISO/IEC 27001
12 4 (0.65%) COSHH
12 4 (0.65%) HIPAA
12 4 (0.65%) IEC 62304
12 4 (0.65%) PMO
12 4 (0.65%) SLA
13 3 (0.49%) Accessibility
13 3 (0.49%) NIST
System Software
1 22 (3.59%) Active Directory
2 13 (2.12%) VMware Infrastructure
3 5 (0.82%) Docker
3 5 (0.82%) Hyper-V
4 4 (0.65%) VMware Server
5 3 (0.49%) VMware ESXi
Systems Management
1 12 (1.96%) Terraform
2 8 (1.31%) SCOM
3 6 (0.98%) Ansible
4 4 (0.65%) Functional Safety
5 3 (0.49%) Failover Clustering
5 3 (0.49%) FortiGate
5 3 (0.49%) Progress Chef
5 3 (0.49%) SCCM
5 3 (0.49%) Wonderware InTouch
6 2 (0.33%) Kubernetes
7 1 (0.16%) Active Directory Federation Services
7 1 (0.16%) DatAdvantage
7 1 (0.16%) Puppet
7 1 (0.16%) QRadar
7 1 (0.16%) Stealthwatch
7 1 (0.16%) Symantec Endpoint Protection
7 1 (0.16%) vCenter Server
7 1 (0.16%) WSUS
Vendors
1 91 (14.85%) Microsoft
2 33 (5.38%) Google
3 30 (4.89%) SAP
4 13 (2.12%) VMware
5 9 (1.47%) Nintex
5 9 (1.47%) Salesforce
6 6 (0.98%) Databricks
6 6 (0.98%) Siemens
7 5 (0.82%) Rockwell
7 5 (0.82%) ServiceNow
8 4 (0.65%) AVEVA
8 4 (0.65%) Cisco
8 4 (0.65%) HP
8 4 (0.65%) MuleSoft
8 4 (0.65%) SYSPRO
9 3 (0.49%) Adobe
9 3 (0.49%) Allen-Bradley
9 3 (0.49%) New Relic
9 3 (0.49%) RedGate
9 3 (0.49%) Wonderware