Confluence Jobs in the UK excluding London

Confluence
UK > UK excluding London

The following table provides summary statistics for permanent job vacancies advertised in the UK excluding London with a requirement for Confluence skills. Included is a benchmarking guide to the salaries offered in vacancies that have cited Confluence over the 6 months to 27 April 2024 with a comparison to the same period in the previous 2 years.

6 months to
27 Apr 2024
Same period 2023 Same period 2022
Rank 286 258 234
Rank change year-on-year -28 -24 -8
Permanent jobs citing Confluence 667 819 1,093
As % of all permanent jobs advertised in the UK excluding London 0.95% 1.33% 1.55%
As % of the Application Platforms category 9.18% 12.80% 11.90%
Number of salaries quoted 473 459 643
10th Percentile £27,500 £42,500 £37,500
25th Percentile £37,500 £51,833 £43,750
Median annual salary (50th Percentile) £51,700 £60,000 £55,000
Median % change year-on-year -13.83% +9.09% -4.35%
75th Percentile £71,250 £72,500 £70,000
90th Percentile £87,500 £85,000 £75,040
UK median annual salary £57,500 £65,000 £62,500
% change year-on-year -11.54% +4.00% -

All Application Platform Skills
UK excluding London

Confluence is in the Application Platforms category. The following table is for comparison with the above and provides summary statistics for all permanent job vacancies advertised in the UK excluding London with a requirement for application platform skills.

Permanent vacancies with a requirement for application platform skills 7,268 6,399 9,182
As % of all permanent jobs advertised in the UK excluding London 10.38% 10.35% 13.01%
Number of salaries quoted 4,667 4,051 5,875
10th Percentile £26,250 £28,000 £26,250
25th Percentile £31,250 £35,000 £32,500
Median annual salary (50th Percentile) £42,500 £47,500 £45,000
Median % change year-on-year -10.53% +5.56% -
75th Percentile £57,500 £62,500 £60,000
90th Percentile £72,500 £77,500 £75,000
UK median annual salary £50,000 £55,000 £54,000
% change year-on-year -9.09% +1.85% +2.86%

Confluence
Job Vacancy Trend in the UK excluding London

Job postings citing Confluence as a proportion of all IT jobs advertised in the UK excluding London.
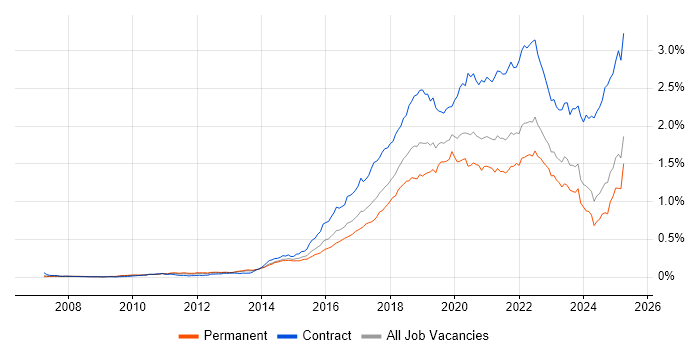
Job vacancy trend for Confluence in the UK excluding London

Confluence
Salary Trend in the UK excluding London

3-month moving average salary quoted in jobs citing Confluence in the UK excluding London.

Salary trend for Confluence in the UK excluding London

Confluence
Salary Histogram in the UK excluding London

Salary distribution for jobs citing Confluence in the UK excluding London over the 6 months to 27 April 2024.

Salary histogram for Confluence in the UK excluding London

Confluence
Job Locations in the UK excluding London

The table below looks at the demand and provides a guide to the median salaries quoted in IT jobs citing Confluence within the UK excluding London region over the 6 months to 27 April 2024. The 'Rank Change' column provides an indication of the change in demand within each location based on the same 6 month period last year.

Location Rank Change
on Same Period
Last Year
Matching
Permanent
IT Job Ads
Median Salary
Past 6 Months
Median Salary
% Change
on Same Period
Last Year
Live
Jobs
South West +57 206 £48,625 -15.89% 23
North of England +3 146 £70,000 +12.00% 36
Scotland -87 91 £62,500 -3.06% 11
South East -6 88 £60,500 -3.20% 47
Midlands -90 78 £42,500 -32.00% 20
North West -3 71 £60,000 -4.00% 19
Yorkshire +45 58 £70,288 +9.77% 16
West Midlands -91 47 £55,000 -8.33% 14
East of England -17 33 £55,000 -4.35% 12
East Midlands -1 28 £37,250 -42.69% 6
Wales +30 18 £60,000 -13.60% 3
North East +4 17 £70,000 -9.68% 1
Northern Ireland - 7 - -
Confluence
UK

Confluence
Co-occurring Skills and Capabilities in the UK excluding London by Category

The follow tables expand on the table above by listing co-occurrences grouped by category. The same employment type, locality and period is covered with up to 20 co-occurrences shown in each of the following categories:

Application Platforms
1 38 (5.70%) SharePoint
2 10 (1.50%) Apache Airflow
3 9 (1.35%) Adobe Experience Manager
4 6 (0.90%) Jupyter
4 6 (0.90%) Microsoft Exchange
5 5 (0.75%) Apache
5 5 (0.75%) Apache Spark
5 5 (0.75%) Tomcat
6 4 (0.60%) SAS
7 3 (0.45%) CMS
7 3 (0.45%) nginx
8 1 (0.15%) Red Hat Fuse
8 1 (0.15%) WordPress
Applications
1 44 (6.60%) Microsoft Office
2 43 (6.45%) MS Visio
3 22 (3.30%) Microsoft Excel
4 18 (2.70%) Microsoft PowerPoint
5 13 (1.95%) Trello
6 5 (0.75%) Doxygen
7 4 (0.60%) Maya
7 4 (0.60%) MotionBuilder
8 3 (0.45%) Microsoft Project
9 2 (0.30%) Adobe Illustrator
9 2 (0.30%) Gliffy
9 2 (0.30%) Photoshop
10 1 (0.15%) 1Password
10 1 (0.15%) Acrobat
10 1 (0.15%) Camtasia
Business Applications
1 4 (0.60%) MIS ActiveH
Cloud Services
1 94 (14.09%) Azure
2 79 (11.84%) AWS
3 62 (9.30%) Microsoft 365
4 42 (6.30%) Power Platform
5 35 (5.25%) GCP
6 29 (4.35%) Miro
7 23 (3.45%) Dynamics 365
8 21 (3.15%) SaaS
9 18 (2.70%) GitHub
10 17 (2.55%) Azure DevOps
10 17 (2.55%) Slack
11 14 (2.10%) AWS CloudFormation
11 14 (2.10%) Entra ID
12 12 (1.80%) Cloud Computing
13 10 (1.50%) dbt
14 7 (1.05%) Google Analytics
15 6 (0.90%) Microsoft Purview
15 6 (0.90%) Snowflake
15 6 (0.90%) WhatsApp
15 6 (0.90%) Yammer
Communications & Networking
1 18 (2.70%) Firewall
2 17 (2.55%) DNS
2 17 (2.55%) Wi-Fi
3 9 (1.35%) TCP/IP
4 7 (1.05%) SSL
5 6 (0.90%) Internet
6 5 (0.75%) DHCP
6 5 (0.75%) Softphone
6 5 (0.75%) VPN
7 4 (0.60%) Bluetooth
7 4 (0.60%) Network Security
7 4 (0.60%) VLAN
7 4 (0.60%) ZigBee
8 3 (0.45%) HTTPS
9 2 (0.30%) VoIP
10 1 (0.15%) Broadband
10 1 (0.15%) HTTP
10 1 (0.15%) LAN
10 1 (0.15%) SSH
10 1 (0.15%) WAN
Database & Business Intelligence
1 37 (5.55%) Power BI
2 31 (4.65%) Tableau
3 23 (3.45%) PostgreSQL
4 21 (3.15%) MySQL
5 19 (2.85%) Relational Database
6 18 (2.70%) NoSQL
7 15 (2.25%) SQL Server
8 14 (2.10%) Data Warehouse
9 13 (1.95%) Data Lake
10 11 (1.65%) BigQuery
10 11 (1.65%) Looker
11 7 (1.05%) Data Mining
11 7 (1.05%) Metadata
12 6 (0.90%) Amazon Redshift
12 6 (0.90%) MongoDB
13 5 (0.75%) Airbyte
13 5 (0.75%) Qlik Sense
13 5 (0.75%) SAP BW
14 4 (0.60%) Enterprise Data Warehouse
15 3 (0.45%) Metabase
Development Applications
1 622 (93.25%) JIRA
2 191 (28.64%) Git
3 138 (20.69%) Bitbucket
4 103 (15.44%) Visual Studio
5 62 (9.30%) Sourcetree
6 47 (7.05%) Jenkins
7 36 (5.40%) GitLab
8 18 (2.70%) Selenium
9 12 (1.80%) JUnit
10 11 (1.65%) Cucumber
11 9 (1.35%) gulp
12 8 (1.20%) CircleCI
12 8 (1.20%) ClearCase
12 8 (1.20%) ClearQuest
13 7 (1.05%) Cypress.io
14 6 (0.90%) MSTest
14 6 (0.90%) Spinnaker
15 5 (0.75%) Postman
15 5 (0.75%) Sonatype Nexus
16 4 (0.60%) SonarQube
General
1 216 (32.38%) Finance
2 194 (29.09%) Social Skills
3 117 (17.54%) Presentation Skills
4 98 (14.69%) Games
5 94 (14.09%) Analytical Skills
6 92 (13.79%) Inclusion and Diversity
7 75 (11.24%) Banking
8 74 (11.09%) Law
9 56 (8.40%) Public Sector
10 40 (6.00%) Marketing
11 28 (4.20%) Retail
12 25 (3.75%) Investment Banking
13 17 (2.55%) Corporate Banking
13 17 (2.55%) French Language
13 17 (2.55%) Manufacturing
14 14 (2.10%) Organisational Skills
15 12 (1.80%) Electronics
16 11 (1.65%) Documentation Skills
16 11 (1.65%) Influencing Skills
17 10 (1.50%) Police
Job Titles
1 132 (19.79%) Developer
2 122 (18.29%) Senior
3 114 (17.09%) Analyst
4 106 (15.89%) Lead
5 88 (13.19%) 3D Developer
5 88 (13.19%) Games Developer
5 88 (13.19%) Unity 3D Developer
6 69 (10.34%) Business Analyst
7 51 (7.65%) Senior Developer
8 43 (6.45%) Programme Manager
9 38 (5.70%) Software Engineer
10 30 (4.50%) Senior Games Developer
11 27 (4.05%) Service Analyst
12 26 (3.90%) Senior Analyst
12 26 (3.90%) Senior Business Analyst
13 24 (3.60%) Test Engineer
14 18 (2.70%) Java Developer
15 17 (2.55%) Senior Java Developer
16 16 (2.40%) Project Manager
16 16 (2.40%) Support Engineer
Libraries, Frameworks & Software Standards
1 88 (13.19%) Unity (Game Engine)
2 36 (5.40%) RESTful
3 31 (4.65%) .NET
4 30 (4.50%) Node.js
5 21 (3.15%) React
5 21 (3.15%) Spring
6 20 (3.00%) CSS
6 20 (3.00%) HTML
7 17 (2.55%) AngularJS
8 11 (1.65%) Vue
9 9 (1.35%) .NET Framework
9 9 (1.35%) jQuery
9 9 (1.35%) JSON
9 9 (1.35%) WPF
10 8 (1.20%) XML
11 7 (1.05%) Jest
11 7 (1.05%) Kafka
11 7 (1.05%) Web Services
12 6 (0.90%) REST
13 5 (0.75%) Entity Framework
Miscellaneous
1 88 (13.19%) Virtual Reality
2 79 (11.84%) Product Ownership
3 33 (4.95%) Mobile App
4 23 (3.45%) Onboarding
5 20 (3.00%) Cloud Native
6 15 (2.25%) IoT
7 10 (1.50%) Mainframe
7 10 (1.50%) Public Cloud
8 8 (1.20%) Data Centre
8 8 (1.20%) Management Information System
9 7 (1.05%) EPoS
9 7 (1.05%) Market Risk
10 5 (0.75%) Algorithms
10 5 (0.75%) Device Driver
10 5 (0.75%) Hybrid Cloud
10 5 (0.75%) Self-Motivation
10 5 (0.75%) SIMD
10 5 (0.75%) Wiki
11 4 (0.60%) Distributed Systems
11 4 (0.60%) Greenfield Project
Operating Systems
1 60 (9.00%) Linux
2 51 (7.65%) Windows
3 19 (2.85%) Windows Server
4 16 (2.40%) Mac OS
5 12 (1.80%) Unix
5 12 (1.80%) Windows Server 2016
5 12 (1.80%) Windows Server 2019
6 7 (1.05%) Android
6 7 (1.05%) Apple iOS
6 7 (1.05%) Windows 10
7 5 (0.75%) Embedded Linux
8 4 (0.60%) Mac OS X
8 4 (0.60%) Ubuntu
9 3 (0.45%) Amazon Linux
9 3 (0.45%) Windows 7
9 3 (0.45%) Windows Server 2008
10 1 (0.15%) CentOS
10 1 (0.15%) Red Hat Enterprise Linux
Processes & Methodologies
1 340 (50.97%) Agile
2 195 (29.24%) Scrum
3 174 (26.09%) DevOps
4 145 (21.74%) Software Engineering
5 110 (16.49%) Mentoring
6 108 (16.19%) UML
7 104 (15.59%) Project Management
8 102 (15.29%) Use Case
9 98 (14.69%) Continuous Improvement
9 98 (14.69%) Design Patterns
10 97 (14.54%) Coaching
11 95 (14.24%) Problem-Solving
12 79 (11.84%) Roadmaps
13 69 (10.34%) User Stories
14 65 (9.75%) Business Analysis
15 63 (9.45%) CI/CD
15 63 (9.45%) Test Automation
16 52 (7.80%) Requirements Gathering
16 52 (7.80%) Scaled Agile Framework
17 47 (7.05%) Budget Management
Programming Languages
1 128 (19.19%) C#
2 90 (13.49%) SQL
3 55 (8.25%) JavaScript
4 53 (7.95%) Java
5 42 (6.30%) Python
6 18 (2.70%) TypeScript
7 14 (2.10%) C++
7 14 (2.10%) PHP
8 11 (1.65%) MATLAB
9 10 (1.50%) C
10 9 (1.35%) Bash
11 7 (1.05%) Ruby
12 6 (0.90%) PowerShell
12 6 (0.90%) VBA
13 5 (0.75%) Perl
13 5 (0.75%) Shell Script
14 4 (0.60%) Go
15 3 (0.45%) Groovy
16 2 (0.30%) R
16 2 (0.30%) Tcl
Qualifications
1 219 (32.83%) Degree
2 149 (22.34%) Security Cleared
3 141 (21.14%) SC Cleared
4 90 (13.49%) BPSS Clearance
5 14 (2.10%) PMI Certification
6 13 (1.95%) Computer Science Degree
6 13 (1.95%) PMP
7 11 (1.65%) APMG
8 10 (1.50%) Azure Certification
9 8 (1.20%) DV Cleared
10 7 (1.05%) IIBA
11 6 (0.90%) CSPO
11 6 (0.90%) Master's Degree
12 5 (0.75%) DBS Check
13 3 (0.45%) ISTQB
13 3 (0.45%) ISTQB Foundation Certification
13 3 (0.45%) ITIL Certification
14 2 (0.30%) CAPM
14 2 (0.30%) CBAP
14 2 (0.30%) SAFe Agilist
Quality Assurance & Compliance
1 39 (5.85%) QA
2 29 (4.35%) ISO/IEC 15288
3 17 (2.55%) Accessibility
4 16 (2.40%) GDPR
5 15 (2.25%) ISO 9001
6 13 (1.95%) PMO
7 10 (1.50%) Data Quality
8 8 (1.20%) PSD2
9 6 (0.90%) SLA
10 5 (0.75%) Actionable Recommendations
11 4 (0.60%) Cyber Essentials
12 3 (0.45%) IEC 62304
12 3 (0.45%) ISO 13485
13 1 (0.15%) Disclosure Scotland
13 1 (0.15%) Government Security Classifications
13 1 (0.15%) NCSC
System Software
1 16 (2.40%) Docker
2 10 (1.50%) Active Directory
3 9 (1.35%) VMware Infrastructure
4 8 (1.20%) vSphere
5 2 (0.30%) iptables
5 2 (0.30%) Virtual Machines
Systems Management
1 22 (3.30%) Kubernetes
2 20 (3.00%) Terraform
3 7 (1.05%) Ansible
4 6 (0.90%) Jamf Pro
4 6 (0.90%) Opsgenie
5 5 (0.75%) Microsoft Intune
6 4 (0.60%) Single Sign-On
6 4 (0.60%) vRealize
6 4 (0.60%) vRealize Orchestrator
7 2 (0.30%) Grafana
7 2 (0.30%) Istio
7 2 (0.30%) Kibana
7 2 (0.30%) Prometheus
7 2 (0.30%) Rancher
8 1 (0.15%) Consul
8 1 (0.15%) FortiGate
8 1 (0.15%) HP ALM
8 1 (0.15%) Packer
8 1 (0.15%) Progress Chef
8 1 (0.15%) systemd
Vendors
1 197 (29.54%) Microsoft
2 108 (16.19%) Atlassian
3 43 (6.45%) Google
3 43 (6.45%) ServiceNow
4 27 (4.05%) Salesforce
5 17 (2.55%) VMware
6 14 (2.10%) SAP
6 14 (2.10%) Teradata
7 13 (1.95%) Adobe
8 12 (1.80%) Apple
8 12 (1.80%) Oracle
9 11 (1.65%) BiZZdesign
9 11 (1.65%) Citrix
9 11 (1.65%) IBM
10 10 (1.50%) Cadence
11 9 (1.35%) AppDynamics
11 9 (1.35%) MuleSoft
12 8 (1.20%) Duck Creek
13 7 (1.05%) Commvault
14 5 (0.75%) Dell