REST Jobs in the UK excluding London

Representational State Transfer (REST)
UK > UK excluding London

The table below provides summary statistics for permanent job vacancies advertised in the UK excluding London requiring REST skills. It includes a benchmarking guide to the annual salaries offered in vacancies that cited REST over the 6 months leading up to 26 July 2024, comparing them to the same period in the previous two years.

6 months to
26 Jul 2024
Same period 2023 Same period 2022
Rank 152 121 131
Rank change year-on-year -31 +10 -56
Permanent jobs citing REST 1,133 1,333 2,144
As % of all permanent jobs advertised in the UK excluding London 1.74% 2.77% 2.74%
As % of the Libraries, Frameworks & Software Standards category 9.74% 11.02% 8.77%
Number of salaries quoted 631 690 1,356
10th Percentile £40,000 £40,000 £36,250
25th Percentile £43,750 £47,500 £43,750
Median annual salary (50th Percentile) £55,000 £60,000 £55,000
Median % change year-on-year -8.33% +9.09% +10.00%
75th Percentile £65,000 £72,500 £71,250
90th Percentile £80,000 £85,000 £80,000
UK median annual salary £60,000 £70,000 £65,000
% change year-on-year -14.29% +7.69% +9.24%

All Software Libraries and Frameworks
UK excluding London

REST falls under the Software Libraries and Frameworks category. For comparison with the information above, the following table provides summary statistics for all permanent job vacancies requiring technical specification, industry standards, software libraries and framework skills in the UK excluding London.

Permanent vacancies with a requirement for technical specification, industry standards, software libraries and framework skills 11,631 12,099 24,450
As % of all permanent jobs advertised in the UK excluding London 17.82% 25.13% 31.22%
Number of salaries quoted 8,091 7,940 14,523
10th Percentile £34,000 £36,250 £35,000
25th Percentile £42,500 £45,000 £42,500
Median annual salary (50th Percentile) £55,000 £57,500 £55,000
Median % change year-on-year -4.35% +4.55% +10.00%
75th Percentile £68,750 £72,500 £70,000
90th Percentile £80,000 £85,000 £82,500
UK median annual salary £60,000 £67,500 £65,000
% change year-on-year -11.11% +3.85% +13.04%

REST
Job Vacancy Trend in the UK excluding London

Job postings citing REST as a proportion of all IT jobs advertised in the UK excluding London.
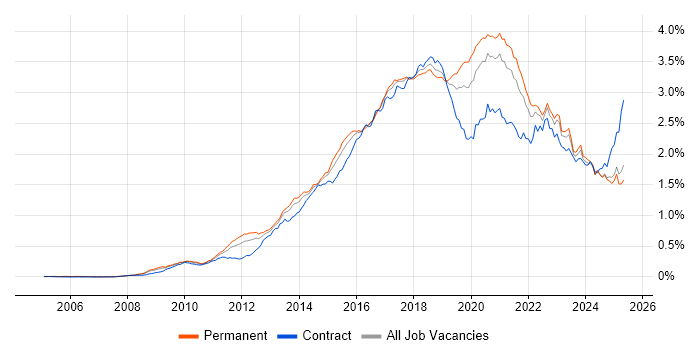
Job vacancy trend for REST in the UK excluding London

REST
Salary Trend in the UK excluding London

3-month moving average salary quoted in jobs citing REST in the UK excluding London.

Salary trend for REST in the UK excluding London

REST
Salary Histogram in the UK excluding London

Salary distribution for jobs citing REST in the UK excluding London over the 6 months to 26 July 2024.

Salary histogram for REST in the UK excluding London

REST
Job Locations in the UK excluding London

The table below looks at the demand and provides a guide to the median salaries quoted in IT jobs citing REST within the UK excluding London region over the 6 months to 26 July 2024. The 'Rank Change' column provides an indication of the change in demand within each location based on the same 6 month period last year.

Location Rank Change
on Same Period
Last Year
Matching
Permanent
IT Job Ads
Median Salary
Past 6 Months
Median Salary
% Change
on Same Period
Last Year
Live
Jobs
North of England +26 354 £55,000 -15.38% 30
South East -24 288 £57,500 +3.25% 38
North West +73 269 £60,000 -7.69% 25
Midlands -65 166 £52,500 -12.50% 10
South West -24 124 £53,500 -10.83% 10
East Midlands -23 106 £52,500 -10.64% 3
Scotland -35 91 £57,500 +4.55% 8
Yorkshire -20 67 £52,500 -12.50% 3
West Midlands -73 60 £52,500 -12.50% 7
East of England -20 58 £48,750 -18.75% 9
Wales +21 36 £51,250 -21.15% 1
North East -31 18 £47,500 -24.00% 2
Northern Ireland -26 17 £57,500 +15.00% 7
Channel Islands - 1 £67,500 -
REST
UK

REST
Co-occurring Skills and Capabilities in the UK excluding London by Category

The follow tables expand on the table above by listing co-occurrences grouped by category. The same employment type, locality and period is covered with up to 20 co-occurrences shown in each of the following categories:

Application Platforms
1 80 (7.06%) Apache
2 74 (6.53%) IIS
3 35 (3.09%) Apache Spark
4 21 (1.85%) CMS
4 21 (1.85%) GemFire
5 17 (1.50%) Cloud Foundry
6 11 (0.97%) OpenStack
7 9 (0.79%) Umbraco
7 9 (0.79%) WildFly
8 6 (0.53%) Confluence
9 5 (0.44%) Apache Airflow
9 5 (0.44%) JBoss
9 5 (0.44%) nginx
9 5 (0.44%) Red Hat Fuse
9 5 (0.44%) SharePoint
10 3 (0.26%) Microsoft Exchange
11 2 (0.18%) BizTalk Server
11 2 (0.18%) SAS
11 2 (0.18%) WordPress
12 1 (0.088%) Sitecore CMS
Applications
1 9 (0.79%) Trello
2 6 (0.53%) Adobe XD
3 5 (0.44%) MS Visio
4 4 (0.35%) Microsoft Excel
5 1 (0.088%) Microsoft Office
Business Applications
1 10 (0.88%) NEC Housing
2 9 (0.79%) Dynamics CRM
3 4 (0.35%) Payment Gateway
4 2 (0.18%) Magento
4 2 (0.18%) Oracle EBS
4 2 (0.18%) Shopify
5 1 (0.088%) Maximo
5 1 (0.088%) NetSuite
5 1 (0.088%) Oracle ERP
5 1 (0.088%) Sage X3
5 1 (0.088%) SAP ERP
Cloud Services
1 529 (46.69%) Azure
2 314 (27.71%) AWS
3 231 (20.39%) IBM Cloud
4 199 (17.56%) Azure DevOps
5 194 (17.12%) Serverless
6 131 (11.56%) Azure Service Bus
7 123 (10.86%) Azure Functions
8 118 (10.41%) Azure API Management
9 117 (10.33%) Azure Logic Apps
10 80 (7.06%) GCP
11 63 (5.56%) Amazon Kinesis
12 52 (4.59%) GitHub
13 51 (4.50%) Amazon EKS
14 40 (3.53%) AWS Lambda
15 29 (2.56%) AWS CloudFormation
15 29 (2.56%) OpenShift
15 29 (2.56%) SaaS
16 25 (2.21%) Amazon ECS
16 25 (2.21%) Power Platform
17 18 (1.59%) Firebase
Communications & Networking
1 50 (4.41%) DNS
2 47 (4.15%) Firewall
3 30 (2.65%) AMQP
4 29 (2.56%) TCP/IP
5 20 (1.77%) MQTT
5 20 (1.77%) SSL
6 17 (1.50%) HTTP
6 17 (1.50%) Kerberos
7 13 (1.15%) 3G
7 13 (1.15%) 4G
7 13 (1.15%) RS-485
7 13 (1.15%) Wi-Fi
7 13 (1.15%) Wireless
8 5 (0.44%) Broadband
9 3 (0.26%) DMZ
9 3 (0.26%) iSCSI
9 3 (0.26%) SAN
9 3 (0.26%) VLAN
9 3 (0.26%) VoIP
9 3 (0.26%) VPN
Database & Business Intelligence
1 410 (36.19%) PostgreSQL
2 348 (30.71%) NoSQL
3 285 (25.15%) MongoDB
4 231 (20.39%) DB2
5 183 (16.15%) Relational Database
6 159 (14.03%) SQL Server
7 77 (6.80%) Amazon Aurora
8 76 (6.71%) MySQL
9 74 (6.53%) DynamoDB
10 68 (6.00%) Redis
11 38 (3.35%) CockroachDB
12 32 (2.82%) Big Data
13 30 (2.65%) Hadoop
14 29 (2.56%) Cloudera CDH
15 22 (1.94%) Apache Cassandra
16 21 (1.85%) Hazelcast
17 18 (1.59%) Amazon RDS
17 18 (1.59%) Elasticsearch
17 18 (1.59%) Power BI
18 11 (0.97%) SQL Server Reporting Services
Development Applications
1 219 (19.33%) Git
2 76 (6.71%) Jenkins
3 65 (5.74%) JIRA
4 44 (3.88%) Gatling
5 38 (3.35%) JUnit
6 36 (3.18%) Visual Studio
7 35 (3.09%) Jasmine
8 33 (2.91%) Selenium
9 32 (2.82%) Octopus Deploy
10 29 (2.56%) GitLab
10 29 (2.56%) Postman
11 28 (2.47%) Karma Test Runner
12 21 (1.85%) Jaeger
12 21 (1.85%) Maven
13 20 (1.77%) Cucumber
14 18 (1.59%) Team Foundation Server
15 16 (1.41%) IntelliJ
16 15 (1.32%) Eclipse
16 15 (1.32%) MSBuild
17 14 (1.24%) Visual Studio Code
General
1 279 (24.62%) Public Sector
2 238 (21.01%) Social Skills
3 180 (15.89%) Finance
4 166 (14.65%) Inclusion and Diversity
5 74 (6.53%) Law
6 52 (4.59%) Analytical Skills
7 42 (3.71%) Retail
8 37 (3.27%) Marketing
9 34 (3.00%) Banking
10 32 (2.82%) Billing
10 32 (2.82%) Electronics
11 29 (2.56%) Aerospace
12 21 (1.85%) Investment Banking
13 20 (1.77%) Games
14 18 (1.59%) Legal
15 15 (1.32%) Manufacturing
16 12 (1.06%) Mandarin Language
16 12 (1.06%) Telecoms
17 10 (0.88%) Local Government
17 10 (0.88%) Police
Job Titles
1 603 (53.22%) Developer
2 195 (17.21%) Senior
3 183 (16.15%) Software Engineer
4 152 (13.42%) Full Stack Developer
5 130 (11.47%) Full Stack Engineer
6 118 (10.41%) Azure Developer
7 117 (10.33%) Lead
8 112 (9.89%) Senior Developer
9 108 (9.53%) Azure Engineer
10 78 (6.88%) .NET Developer
11 73 (6.44%) Java Developer
12 62 (5.47%) Lead Software Engineer
13 59 (5.21%) C# Developer
14 55 (4.85%) Java Engineer
14 55 (4.85%) Software Developer
15 49 (4.32%) Architect
16 41 (3.62%) Java Software Engineer
17 40 (3.53%) Senior Software Engineer
18 39 (3.44%) Lead Java Engineer
19 36 (3.18%) Lead Developer
Libraries, Frameworks & Software Standards
1 514 (45.37%) Web Services
2 494 (43.60%) .NET
3 458 (40.42%) HTML
4 443 (39.10%) CSS
5 404 (35.66%) React
6 381 (33.63%) AngularJS
7 336 (29.66%) ASP.NET
8 303 (26.74%) Vue
9 284 (25.07%) Twitter Bootstrap
10 279 (24.62%) jQuery
11 239 (21.09%) ASP.NET Core
12 231 (20.39%) Backbone.js
12 231 (20.39%) Ember.js
13 207 (18.27%) Node.js
14 200 (17.65%) SOAP
15 166 (14.65%) JSON
16 160 (14.12%) Spring
17 153 (13.50%) GraphQL
18 127 (11.21%) XML
19 126 (11.12%) Spring Boot
Miscellaneous
1 243 (21.45%) Algorithms
2 239 (21.09%) Hybrid Cloud
3 236 (20.83%) Data Structures
4 231 (20.39%) Blockchain
5 118 (10.41%) e-Learning
6 74 (6.53%) Cloud Native
7 69 (6.09%) Distributed Systems
8 67 (5.91%) Self-Motivation
9 65 (5.74%) Blog
10 63 (5.56%) Media Streaming
11 40 (3.53%) Enterprise Software
12 29 (2.56%) Replication
13 27 (2.38%) Product Ownership
14 26 (2.29%) Greenfield Project
15 21 (1.85%) Foreign Exchange (FX)
16 18 (1.59%) Legacy Systems
16 18 (1.59%) Public Cloud
17 17 (1.50%) Management Information System
17 17 (1.50%) Mobile App
18 13 (1.15%) NHS
Operating Systems
1 376 (33.19%) Linux
2 301 (26.57%) Windows
3 265 (23.39%) Android
4 253 (22.33%) Apple iOS
5 36 (3.18%) Ubuntu
6 29 (2.56%) CentOS
6 29 (2.56%) Debian
6 29 (2.56%) Red Hat Enterprise Linux
7 26 (2.29%) AIX
8 18 (1.59%) Embedded Linux
9 15 (1.32%) Windows Server
10 7 (0.62%) VMS
11 6 (0.53%) Unix
Processes & Methodologies
1 550 (48.54%) Agile
2 365 (32.22%) MVC
3 349 (30.80%) OO
4 336 (29.66%) DevOps
5 324 (28.60%) Web Development
6 313 (27.63%) Design Patterns
7 311 (27.45%) Full Stack Development
8 304 (26.83%) OOP
9 285 (25.15%) User Experience
10 274 (24.18%) SOLID
11 265 (23.39%) Software Engineering
12 249 (21.98%) Artificial Intelligence
13 248 (21.89%) MVVM
14 233 (20.56%) Responsive Web Design
15 232 (20.48%) Co-Creation
15 232 (20.48%) Mentoring
16 231 (20.39%) Design Thinking
17 212 (18.71%) Microservices
18 173 (15.27%) Coaching
19 160 (14.12%) Problem-Solving
Programming Languages
1 585 (51.63%) JavaScript
2 584 (51.54%) SQL
3 480 (42.37%) C#
4 407 (35.92%) Java
5 259 (22.86%) Python
6 123 (10.86%) TypeScript
7 63 (5.56%) Scala
7 63 (5.56%) T-SQL
8 57 (5.03%) PHP
9 55 (4.85%) VB.NET
10 54 (4.77%) C
11 53 (4.68%) C++
12 49 (4.32%) VB
13 46 (4.06%) Go
14 28 (2.47%) PowerShell
14 28 (2.47%) VB6
15 25 (2.21%) Apex Code
16 22 (1.94%) Groovy
17 19 (1.68%) Kotlin
17 19 (1.68%) XAML
Qualifications
1 104 (9.18%) Degree
2 86 (7.59%) Security Cleared
3 67 (5.91%) SC Cleared
4 66 (5.83%) Computer Science Degree
5 37 (3.27%) DV Cleared
6 15 (1.32%) Azure Certification
6 15 (1.32%) DBS Check
7 9 (0.79%) Master's Degree
7 9 (0.79%) PhD
8 3 (0.26%) CIPD
9 2 (0.18%) ISEB
9 2 (0.18%) ISTQB
9 2 (0.18%) Microsoft Certification
10 1 (0.088%) BPSS Clearance
10 1 (0.088%) CCNA
10 1 (0.088%) Cisco Certification
10 1 (0.088%) Numerate Degree
10 1 (0.088%) PMI Certification
10 1 (0.088%) PMP
10 1 (0.088%) VMware Certified Professional (VCP)
Quality Assurance & Compliance
1 78 (6.88%) QA
2 28 (2.47%) Accessibility
3 26 (2.29%) GDPR
4 4 (0.35%) PCI DSS
5 3 (0.26%) NIST
6 2 (0.18%) Data Quality
6 2 (0.18%) GRC
7 1 (0.088%) ISO/IEC 27001
System Software
1 185 (16.33%) Docker
2 16 (1.41%) Virtual Servers
3 15 (1.32%) Active Directory
4 10 (0.88%) VMware ESXi
4 10 (0.88%) VMware Infrastructure
5 8 (0.71%) Hyper-V
6 6 (0.53%) vSphere
7 5 (0.44%) Firmware
8 3 (0.26%) Virtual Machines
9 2 (0.18%) Ceph
Systems Management
1 156 (13.77%) Kubernetes
2 75 (6.62%) Terraform
3 54 (4.77%) Ansible
4 31 (2.74%) Puppet
5 29 (2.56%) Kibana
6 22 (1.94%) Grafana
6 22 (1.94%) Prometheus
7 21 (1.85%) HAProxy
7 21 (1.85%) ITRS Geneos
7 21 (1.85%) Zipkin
8 8 (0.71%) Failover Clustering
9 5 (0.44%) Single Sign-On
10 3 (0.26%) Microsoft Intune
11 2 (0.18%) Active Directory Federation Services
11 2 (0.18%) N-central
11 2 (0.18%) Rancher
11 2 (0.18%) WMI
12 1 (0.088%) Istio
Vendors
1 260 (22.95%) Red Hat
2 234 (20.65%) IBM
3 113 (9.97%) Microsoft
4 77 (6.80%) Google
5 67 (5.91%) Oracle
6 34 (3.00%) Splunk
7 33 (2.91%) Salesforce
8 29 (2.56%) SaltStack
9 28 (2.47%) Dynatrace
10 15 (1.32%) VMware
11 10 (0.88%) NEC
11 10 (0.88%) WSO2
12 9 (0.79%) Adobe
13 7 (0.62%) ServiceNow
14 6 (0.53%) Databricks
14 6 (0.53%) Sybase
15 5 (0.44%) SAP
16 4 (0.35%) Citrix
16 4 (0.35%) Fortinet
16 4 (0.35%) Mitel