Couchbase Server (formerly Membase)
UK > Work from Home
The table below provides summary statistics for permanent remote or hybrid work requiring Couchbase skills. It includes a benchmarking guide to the annual salaries offered in vacancies that cited Couchbase over the 6 months leading up to 2 May 2025, comparing them to the same period in the previous two years.
| 6 months to 2 May 2025 |
Same period 2024 | Same period 2023 | |
|---|---|---|---|
| Rank | 397 | 572 | 660 |
| Rank change year-on-year | +175 | +88 | +102 |
| Permanent jobs citing Couchbase | 16 | 17 | 11 |
| As % of all permanent jobs with a WFH option | 0.11% | 0.050% | 0.026% |
| As % of the Database & Business Intelligence category | 0.49% | 0.22% | 0.10% |
| Number of salaries quoted | 15 | 16 | 8 |
| 10th Percentile | £50,000 | £57,500 | £78,000 |
| 25th Percentile | £60,000 | £66,250 | £78,750 |
| Median annual salary (50th Percentile) | £75,000 | £70,000 | £82,500 |
| Median % change year-on-year | +7.14% | -15.15% | +60.98% |
| 75th Percentile | £85,000 | £137,500 | £86,250 |
| 90th Percentile | £87,500 | - | £92,625 |
| UK median annual salary | £73,750 | £70,000 | £82,500 |
| % change year-on-year | +5.36% | -15.15% | +57.14% |
All Database and Business Intelligence Skills
Work from Home
Couchbase falls under the Databases and Business Intelligence category. For comparison with the information above, the following table provides summary statistics for all permanent job vacancies with remote or hybrid options requiring database or business intelligence skills.
| Permanent vacancies with a requirement for database or business intelligence skills | 3,273 | 7,726 | 10,510 |
| As % of all permanent jobs with a WFH option | 21.87% | 22.83% | 24.62% |
| Number of salaries quoted | 2,414 | 6,220 | 7,215 |
| 10th Percentile | £37,500 | £37,101 | £40,000 |
| 25th Percentile | £50,000 | £43,750 | £49,750 |
| Median annual salary (50th Percentile) | £65,000 | £57,500 | £65,000 |
| Median % change year-on-year | +13.04% | -11.54% | +8.33% |
| 75th Percentile | £90,000 | £75,000 | £82,500 |
| 90th Percentile | £122,500 | £95,000 | £102,500 |
| UK median annual salary | £62,500 | £57,500 | £65,000 |
| % change year-on-year | +8.70% | -11.54% | +8.33% |
Couchbase
Trend for Jobs with a WFH Option
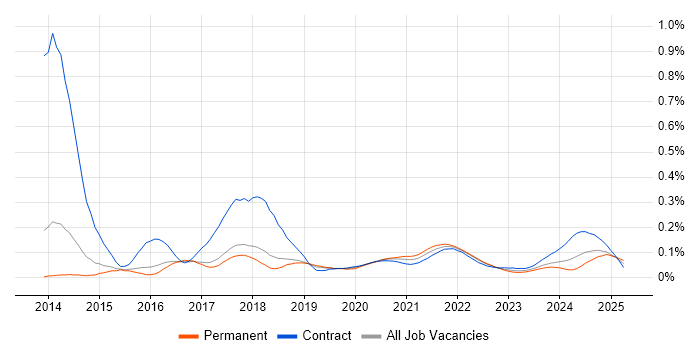
Job vacancies with remote working options citing Couchbase as a proportion of all IT jobs advertised.

Couchbase
Salary Trend for Jobs with a WFH Option
3-month moving average salary quoted in job vacancies with remote working options citing Couchbase.
Couchbase
Salary Histogram for Jobs with a WFH Option
Salary distribution for jobs with remote working options citing Couchbase over the 6 months to 2 May 2025.
Couchbase
Co-occurring Skills and Capabilities with WFH Options by Category
The follow tables expand on the table above by listing co-occurrences grouped by category. The same employment type, locality and period is covered with up to 20 co-occurrences shown in each of the following categories:
