Disaster Recovery Jobs with Hybrid/Remote/WFH Options

Disaster Recovery
UK > Work from Home

The table below provides summary statistics for permanent remote or hybrid work requiring Disaster Recovery skills. It includes a benchmarking guide to the annual salaries offered in vacancies that cited Disaster Recovery over the 6 months leading up to 1 July 2025, comparing them to the same period in the previous two years.

6 months to
1 Jul 2025
Same period 2024 Same period 2023
Rank 293 206 260
Rank change year-on-year -87 +54 +76
Permanent jobs citing Disaster Recovery 185 559 474
As % of all permanent jobs with a WFH option 0.92% 1.62% 1.32%
As % of the Processes & Methodologies category 0.98% 1.81% 1.37%
Number of salaries quoted 140 425 412
10th Percentile £32,000 £41,250 £38,750
25th Percentile £41,813 £51,250 £47,500
Median annual salary (50th Percentile) £60,000 £59,500 £59,526
Median % change year-on-year +0.84% -0.04% +1.75%
75th Percentile £75,188 £78,005 £71,313
90th Percentile £90,375 £96,250 £87,500
UK median annual salary £62,500 £55,000 £57,500
% change year-on-year +13.64% -4.35% +4.55%

All Process and Methodology Skills
Work from Home

Disaster Recovery falls under the Processes and Methodologies category. For comparison with the information above, the following table provides summary statistics for all permanent job vacancies with remote or hybrid options requiring process or methodology skills.

Permanent vacancies with a requirement for process or methodology skills 18,835 30,834 34,578
As % of all permanent jobs with a WFH option 93.27% 89.39% 96.04%
Number of salaries quoted 9,990 22,905 24,939
10th Percentile £25,313 £33,750 £37,500
25th Percentile £40,000 £42,500 £47,500
Median annual salary (50th Percentile) £57,500 £57,500 £62,500
Median % change year-on-year - -8.00% +4.17%
75th Percentile £76,250 £75,250 £81,750
90th Percentile £100,000 £95,000 £100,000
UK median annual salary £55,000 £55,000 £60,331
% change year-on-year - -8.84% +0.55%

Disaster Recovery
Trend for Jobs with a WFH Option

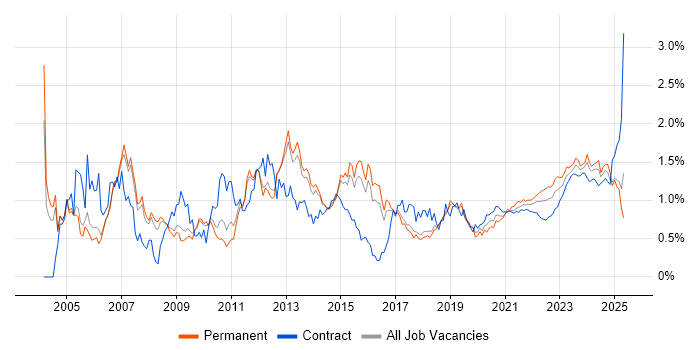
Job vacancies with remote working options citing Disaster Recovery as a proportion of all IT jobs advertised.

Disaster Recovery trend for jobs with Hybrid/Remote/WFH options

Disaster Recovery
Salary Trend for Jobs with a WFH Option

3-month moving average salary quoted in job vacancies with remote working options citing Disaster Recovery.

Disaster Recovery salary trend for jobs with a WFH option

Disaster Recovery
Salary Histogram for Jobs with a WFH Option

Salary distribution for jobs with remote working options citing Disaster Recovery over the 6 months to 1 July 2025.

Disaster Recovery salary histogram for jobs with a WFH option

Disaster Recovery
Co-occurring Skills and Capabilities with WFH Options by Category

The follow tables expand on the table above by listing co-occurrences grouped by category. The same employment type, locality and period is covered with up to 20 co-occurrences shown in each of the following categories:

Application Platforms
1 33 (17.84%) Microsoft Exchange
2 23 (12.43%) SharePoint
3 6 (3.24%) IIS
4 3 (1.62%) Confluence
5 1 (0.54%) Skype for Business
Applications
1 10 (5.41%) Microsoft Office
2 3 (1.62%) Microsoft Excel
3 2 (1.08%) Spreadsheet
Business Applications
1 2 (1.08%) Remedy ITSM
1 2 (1.08%) Sage 200
2 1 (0.54%) SAP S/4HANA
Cloud Services
1 101 (54.59%) Azure
2 57 (30.81%) AWS
2 57 (30.81%) Microsoft 365
3 25 (13.51%) GCP
4 18 (9.73%) Entra ID
5 14 (7.57%) Azure DevOps
6 13 (7.03%) Power Platform
7 12 (6.49%) GitHub
7 12 (6.49%) OneDrive
8 11 (5.95%) Cloud Computing
9 10 (5.41%) Power Automate
10 9 (4.86%) Microsoft Purview
11 8 (4.32%) AWS CloudFormation
11 8 (4.32%) Microsoft Copilot
11 8 (4.32%) PowerApps
11 8 (4.32%) SaaS
12 7 (3.78%) Amazon EC2
12 7 (3.78%) Azure Sentinel
13 6 (3.24%) IaaS
13 6 (3.24%) PaaS
Communications & Networking
1 46 (24.86%) Firewall
2 37 (20.00%) DNS
3 35 (18.92%) DHCP
4 26 (14.05%) VPN
5 21 (11.35%) TCP/IP
6 20 (10.81%) VLAN
7 18 (9.73%) SAN
8 17 (9.19%) WAN
9 15 (8.11%) NAS
10 11 (5.95%) VoIP
11 10 (5.41%) LAN
11 10 (5.41%) Wireless
12 6 (3.24%) ADSL
12 6 (3.24%) Network Security
13 5 (2.70%) SD-WAN
13 5 (2.70%) VSAN
13 5 (2.70%) Wi-Fi
14 4 (2.16%) HTTPS
15 2 (1.08%) Internet
15 2 (1.08%) Intrusion Detection
Database & Business Intelligence
1 35 (18.92%) SQL Server
2 16 (8.65%) Amazon RDS
3 12 (6.49%) NoSQL
4 10 (5.41%) MongoDB
4 10 (5.41%) Power BI
5 9 (4.86%) Azure SQL Database
5 9 (4.86%) PostgreSQL
5 9 (4.86%) SQL Server Integration Services
6 6 (3.24%) MySQL
6 6 (3.24%) Relational Database
6 6 (3.24%) Tableau
7 3 (1.62%) Amazon Aurora
7 3 (1.62%) ClickHouse
7 3 (1.62%) DynamoDB
7 3 (1.62%) Oracle Reports
7 3 (1.62%) RDBMS
8 2 (1.08%) Data Warehouse
9 1 (0.54%) Amazon Athena
9 1 (0.54%) Oracle Database
9 1 (0.54%) SQL Server Reporting Services
Development Applications
1 5 (2.70%) Git
1 5 (2.70%) Jenkins
1 5 (2.70%) Oracle Forms
2 4 (2.16%) Bitbucket
2 4 (2.16%) JIRA
3 3 (1.62%) Maven
3 3 (1.62%) Subversion
4 2 (1.08%) Atlassian Bamboo
4 2 (1.08%) GitLab
5 1 (0.54%) Artifactory
5 1 (0.54%) MSBuild
5 1 (0.54%) Oracle APEX
5 1 (0.54%) SQL Server Management Studio (SSMS)
General
1 61 (32.97%) Finance
2 56 (30.27%) Social Skills
3 25 (13.51%) Analytical Skills
4 17 (9.19%) Banking
5 9 (4.86%) Telecoms
6 7 (3.78%) Presentation Skills
7 6 (3.24%) Manufacturing
8 5 (2.70%) Games
8 5 (2.70%) Investment Banking
8 5 (2.70%) Legal
9 4 (2.16%) Inclusion and Diversity
9 4 (2.16%) Retail
10 3 (1.62%) Law
11 2 (1.08%) Advertising
11 2 (1.08%) Aviation
11 2 (1.08%) Electronics
11 2 (1.08%) Marketing
11 2 (1.08%) Public Sector
12 1 (0.54%) Health Technology
12 1 (0.54%) Organisational Skills
Job Titles
1 33 (17.84%) Infrastructure Engineer
2 25 (13.51%) Analyst
2 25 (13.51%) Senior
3 19 (10.27%) AWS DevOps
3 19 (10.27%) Cloud Engineer
4 18 (9.73%) IT Analyst
4 18 (9.73%) IT Support
4 18 (9.73%) Senior DevOps
5 16 (8.65%) Lead
6 15 (8.11%) Support Engineer
7 13 (7.03%) Architect
7 13 (7.03%) Support Analyst
8 12 (6.49%) AWS Architect
8 12 (6.49%) AWS Solution Architect
8 12 (6.49%) DevOps Architect
8 12 (6.49%) Senior Architect
8 12 (6.49%) Senior Solutions Architect
8 12 (6.49%) Solutions Architect
8 12 (6.49%) TOGAF Architect
9 11 (5.95%) Infrastructure Support
Libraries, Frameworks & Software Standards
1 9 (4.86%) Middleware
2 8 (4.32%) Elastic Stack
3 7 (3.78%) .NET
3 7 (3.78%) REST
4 6 (3.24%) React
4 6 (3.24%) RESTful
5 3 (1.62%) JSON
6 2 (1.08%) AngularJS
6 2 (1.08%) AWS CDK
6 2 (1.08%) AWS SAM
6 2 (1.08%) Ionic Framework
6 2 (1.08%) Spring
6 2 (1.08%) Spring Boot
7 1 (0.54%) boto
7 1 (0.54%) Flask
7 1 (0.54%) Kafka
7 1 (0.54%) OAuth
7 1 (0.54%) RabbitMQ
7 1 (0.54%) RFC 2544
7 1 (0.54%) WebSockets
Miscellaneous
1 26 (14.05%) Management Information System
2 23 (12.43%) Clustering
3 14 (7.57%) Cloud Native
4 11 (5.95%) Data Centre
5 10 (5.41%) Replication
6 8 (4.32%) Hybrid Cloud
6 8 (4.32%) Self-Motivation
7 6 (3.24%) Cyber Threat
7 6 (3.24%) Driving Licence
7 6 (3.24%) Product Ownership
8 3 (1.62%) Greenfield Project
9 2 (1.08%) Analytical Mindset
9 2 (1.08%) Distributed Systems
9 2 (1.08%) Enterprise Software
9 2 (1.08%) Legacy Systems
9 2 (1.08%) Security Posture
10 1 (0.54%) CCTV
10 1 (0.54%) Mobile App
10 1 (0.54%) Public Cloud
10 1 (0.54%) Security Operations Centre
Operating Systems
1 73 (39.46%) Windows
2 50 (27.03%) Linux
3 48 (25.95%) Windows Server
4 20 (10.81%) Unix
5 9 (4.86%) Red Hat Enterprise Linux
6 8 (4.32%) Windows Server 2019
7 7 (3.78%) Windows Server 2008
7 7 (3.78%) Windows Server 2012
8 5 (2.70%) Windows Server 2016
9 4 (2.16%) Solaris
9 4 (2.16%) Windows 10
10 3 (1.62%) Debian
10 3 (1.62%) Mac OS
11 2 (1.08%) AIX
11 2 (1.08%) SUSE
11 2 (1.08%) Ubuntu
11 2 (1.08%) Windows 7
12 1 (0.54%) Android
12 1 (0.54%) Apple iOS
12 1 (0.54%) Mac OS X
Processes & Methodologies
1 55 (29.73%) DevOps
2 48 (25.95%) Problem-Solving
3 46 (24.86%) High Availability
4 43 (23.24%) ITIL
5 42 (22.70%) CI/CD
5 42 (22.70%) Cybersecurity
5 42 (22.70%) Infrastructure Engineering
6 28 (15.14%) Agile
7 24 (12.97%) Mentoring
7 24 (12.97%) Project Delivery
8 21 (11.35%) Business Continuity
8 21 (11.35%) Containerisation
9 20 (10.81%) Microservices
9 20 (10.81%) Migration
10 18 (9.73%) Roadmaps
10 18 (9.73%) Technology Roadmap
11 17 (9.19%) Architectural Design
11 17 (9.19%) Infrastructure Management
12 16 (8.65%) Data Security
12 16 (8.65%) Performance Tuning
Programming Languages
1 44 (23.78%) SQL
2 40 (21.62%) PowerShell
3 37 (20.00%) Python
4 20 (10.81%) Java
5 19 (10.27%) C#
6 15 (8.11%) T-SQL
7 12 (6.49%) JavaScript
8 11 (5.95%) Bash
9 8 (4.32%) Shell Script
10 5 (2.70%) Go
10 5 (2.70%) Perl
11 3 (1.62%) C++
12 2 (1.08%) TypeScript
13 1 (0.54%) Groovy
13 1 (0.54%) Kusto Query Language
13 1 (0.54%) PL/SQL
13 1 (0.54%) SAPscript
13 1 (0.54%) VBScript
Qualifications
1 31 (16.76%) Azure Certification
2 26 (14.05%) AWS Certification
3 19 (10.27%) Microsoft Certification
4 17 (9.19%) Security Cleared
5 16 (8.65%) Degree
6 12 (6.49%) AWS Certified Solutions Architect
7 10 (5.41%) A+ Certification
7 10 (5.41%) Network+ Certification
8 8 (4.32%) DV Cleared
9 7 (3.78%) Cisco Certification
9 7 (3.78%) ITIL Certification
9 7 (3.78%) SC Cleared
9 7 (3.78%) VMware Certified Professional (VCP)
10 5 (2.70%) DBS Check
11 4 (2.16%) CCNA
11 4 (2.16%) CompTIA Security+
12 3 (1.62%) AWS Certified DevOps Engineer
12 3 (1.62%) CISSP
12 3 (1.62%) Computer Science Degree
13 2 (1.08%) IBM AIX Certification
Quality Assurance & Compliance
1 25 (13.51%) GDPR
2 18 (9.73%) SLA
3 15 (8.11%) NIST
4 13 (7.03%) HIPAA
5 11 (5.95%) ISO/IEC 27001
6 6 (3.24%) Cyber Essentials
7 4 (2.16%) Cyber Essentials PLUS
7 4 (2.16%) PCI DSS
8 3 (1.62%) Sarbanes-Oxley
9 2 (1.08%) Data Quality
9 2 (1.08%) ISO 22301
10 1 (0.54%) Accessibility
10 1 (0.54%) Actionable Recommendations
10 1 (0.54%) GRC
10 1 (0.54%) ISO 13485
10 1 (0.54%) QA
System Software
1 60 (32.43%) Active Directory
2 34 (18.38%) VMware Infrastructure
3 21 (11.35%) Docker
4 18 (9.73%) Hyper-V
5 13 (7.03%) Virtual Machines
6 7 (3.78%) VMware ESXi
7 5 (2.70%) Veritas Cluster Server
7 5 (2.70%) VMware NSX
8 4 (2.16%) vSphere
9 2 (1.08%) Firmware
9 2 (1.08%) Virtual Desktop
10 1 (0.54%) pfSense
10 1 (0.54%) VMware Server
Systems Management
1 29 (15.68%) Ansible
2 27 (14.59%) Microsoft Intune
3 26 (14.05%) Kubernetes
4 19 (10.27%) Terraform
5 9 (4.86%) Grafana
5 9 (4.86%) Progress Chef
6 5 (2.70%) Prometheus
7 4 (2.16%) Puppet
7 4 (2.16%) SCCM
8 3 (1.62%) Active Directory Federation Services
8 3 (1.62%) Single Sign-On
9 2 (1.08%) SCOM
10 1 (0.54%) Data Guard
10 1 (0.54%) Dell DRAC
10 1 (0.54%) Nessus
10 1 (0.54%) NetBackup
10 1 (0.54%) Oracle ZFS
10 1 (0.54%) PaperCut
10 1 (0.54%) Red Hat Satellite
Vendors
1 89 (48.11%) Microsoft
2 45 (24.32%) VMware
3 20 (10.81%) Google
4 15 (8.11%) Cisco
4 15 (8.11%) Oracle
5 12 (6.49%) Red Hat
6 10 (5.41%) Veeam
7 6 (3.24%) EMC
7 6 (3.24%) ServiceNow
7 6 (3.24%) Symantec
8 5 (2.70%) Dell
8 5 (2.70%) HP
8 5 (2.70%) Veritas
9 4 (2.16%) Datto
9 4 (2.16%) Sophos
9 4 (2.16%) TOWER Software
10 3 (1.62%) ConnectWise
10 3 (1.62%) ESET
10 3 (1.62%) Ubiquiti
10 3 (1.62%) Zscaler