Site Reliability Engineering Jobs with Work from Home Options

Site Reliability Engineering (SRE)
UK > Work from Home

The table below provides summary statistics for permanent job vacancies with an option to work from home (WFH) and a requirement for Site Reliability Engineering skills. Included is a benchmarking guide to the salaries offered in vacancies that have cited Site Reliability Engineering over the 6 months to 25 April 2024 with a comparison to the same period in the previous 2 years.

6 months to
25 Apr 2024
Same period 2023 Same period 2022
Rank 401 261 268
Rank change year-on-year -140 +7 -26
Permanent jobs citing Site Reliability Engineering 185 558 913
As % of all permanent jobs with a WFH option 0.55% 1.28% 1.37%
As % of the Processes & Methodologies category 0.60% 1.34% 1.42%
Number of salaries quoted 148 409 642
10th Percentile - £43,337 £57,046
25th Percentile £57,597 £58,802 £65,000
Median annual salary (50th Percentile) £77,500 £79,632 £75,000
Median % change year-on-year -2.68% +6.18% +4.17%
75th Percentile £111,250 £100,000 £90,000
90th Percentile £125,000 £107,973 £105,000
UK median annual salary £80,000 £81,000 £75,000
% change year-on-year -1.23% +8.00% -

All Process and Methodology Skills
Work from Home

Site Reliability Engineering is in the Processes and Methodologies category. The following table is for comparison with the above and provides summary statistics for all permanent job vacancies with a WFH option and a requirement for process or methodology skills.

Permanent vacancies with a requirement for process or methodology skills 31,024 41,738 64,495
As % of all permanent jobs with a WFH option 91.68% 96.08% 96.90%
Number of salaries quoted 23,594 28,877 41,026
10th Percentile £33,750 £37,500 £36,250
25th Percentile £42,500 £47,500 £45,000
Median annual salary (50th Percentile) £57,500 £62,500 £60,000
Median % change year-on-year -8.00% +4.17% +9.09%
75th Percentile £75,000 £82,500 £80,000
90th Percentile £95,000 £100,000 £95,000
UK median annual salary £55,000 £61,700 £60,000
% change year-on-year -10.86% +2.83% +9.09%

Site Reliability Engineering
Trend for Jobs with a WFH Option

Job vacancies with a work from home option citing Site Reliability Engineering as a proportion of all IT jobs advertised.
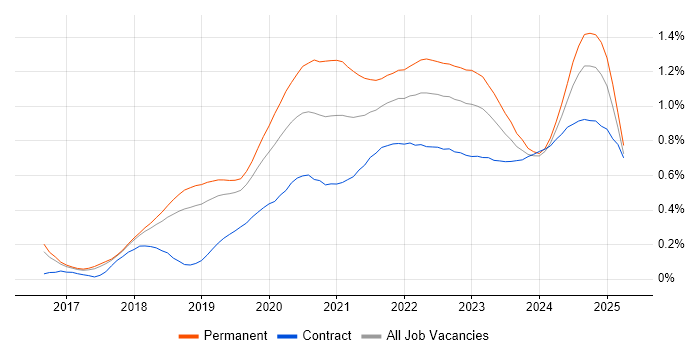
Site Reliability Engineering trend for jobs with a WFH option

Site Reliability Engineering
Salary Trend for Jobs with a WFH Option

3-month moving average salary quoted in job vacancies with a work from home option citing Site Reliability Engineering.

Site Reliability Engineering salary trend for jobs with a WFH option

Site Reliability Engineering
Salary Histogram for Jobs with a WFH Option

Salary distribution for jobs with a work from home option citing Site Reliability Engineering over the 6 months to 25 April 2024.

Site Reliability Engineering salary histogram for jobs with a WFH option

Site Reliability Engineering
Co-occurring Skills and Capabilities with WFH Options by Category

The follow tables expand on the table above by listing co-occurrences grouped by category. The same employment type, locality and period is covered with up to 20 co-occurrences shown in each of the following categories:

Application Platforms
1 30 (16.22%) Apache Airflow
2 7 (3.78%) IIS
3 6 (3.24%) Microsoft Exchange
4 4 (2.16%) Confluence
5 1 (0.54%) nginx
Business Applications
1 2 (1.08%) Remedy ITSM
Cloud Services
1 120 (64.86%) AWS
2 72 (38.92%) Azure
3 30 (16.22%) dbt
3 30 (16.22%) Snowflake
4 22 (11.89%) GCP
5 16 (8.65%) Azure DevOps
6 15 (8.11%) SaaS
7 12 (6.49%) Serverless
8 9 (4.86%) AWS CloudFormation
8 9 (4.86%) AWS Lambda
9 8 (4.32%) Amazon EC2
9 8 (4.32%) Azure AKS
10 6 (3.24%) GitHub
10 6 (3.24%) Rubrik
11 5 (2.70%) Virtual Private Cloud
12 3 (1.62%) Amazon ECS
12 3 (1.62%) AWS Fargate
12 3 (1.62%) Azure Monitor
12 3 (1.62%) IaaS
12 3 (1.62%) Slack
Communications & Networking
1 12 (6.49%) Firewall
2 8 (4.32%) DNS
3 6 (3.24%) BGP
3 6 (3.24%) DHCP
3 6 (3.24%) SAN
4 5 (2.70%) VPN
5 4 (2.16%) SSL
5 4 (2.16%) TCP/IP
6 3 (1.62%) HTTPS
7 2 (1.08%) HTTP
8 1 (0.54%) Anycast
8 1 (0.54%) Internet
Database & Business Intelligence
1 32 (17.30%) Dremio
2 30 (16.22%) Amazon Athena
2 30 (16.22%) Apache Arrow
2 30 (16.22%) Big Data
2 30 (16.22%) Data Lake
3 7 (3.78%) Elasticsearch
3 7 (3.78%) MongoDB
3 7 (3.78%) MySQL
4 6 (3.24%) SQL Server
5 4 (2.16%) Amazon Aurora
5 4 (2.16%) PostgreSQL
5 4 (2.16%) RDBMS
5 4 (2.16%) Relational Database
6 2 (1.08%) InfluxDB
6 2 (1.08%) MariaDB
6 2 (1.08%) Redis
6 2 (1.08%) Sybase ASE
7 1 (0.54%) Data Warehouse
7 1 (0.54%) DynamoDB
7 1 (0.54%) Power BI
Development Applications
1 29 (15.68%) GitLab
2 24 (12.97%) Git
3 22 (11.89%) Jenkins
4 21 (11.35%) Artifactory
5 13 (7.03%) TeamCity
6 7 (3.78%) Octopus Deploy
7 6 (3.24%) JIRA
7 6 (3.24%) Sonatype Nexus
8 5 (2.70%) CircleCI
9 3 (1.62%) Atlassian Bamboo
9 3 (1.62%) Travis CI
10 2 (1.08%) Spinnaker
11 1 (0.54%) Gatling
11 1 (0.54%) git-flow
11 1 (0.54%) JUnit
11 1 (0.54%) LoadRunner
11 1 (0.54%) SonarQube
11 1 (0.54%) Vagrant
General
1 51 (27.57%) Finance
2 25 (13.51%) Public Sector
3 19 (10.27%) Legal
4 18 (9.73%) Social Skills
5 13 (7.03%) Banking
6 8 (4.32%) Law
7 5 (2.70%) Analytical Skills
8 4 (2.16%) Retail
9 3 (1.62%) Investment Banking
10 2 (1.08%) Back Office
10 2 (1.08%) Games
10 2 (1.08%) Inclusion and Diversity
10 2 (1.08%) Pharmaceutical
10 2 (1.08%) Tech for Good
11 1 (0.54%) Marketing
Job Titles
1 59 (31.89%) Site Reliability Engineer
2 56 (30.27%) Site Engineer
3 44 (23.78%) Senior
4 39 (21.08%) AWS Engineer
5 30 (16.22%) Big Data Engineer
5 30 (16.22%) Infrastructure Engineer
6 27 (14.59%) Cloud Engineer
6 27 (14.59%) DevOps Engineer
7 24 (12.97%) Senior Infrastructure Engineer
8 21 (11.35%) Cloud Infrastructure Engineer
8 21 (11.35%) Senior Cloud Engineer
9 16 (8.65%) Software Engineer
10 15 (8.11%) Lead
11 12 (6.49%) Java Engineer
12 9 (4.86%) Lead DevOps
13 8 (4.32%) Java Software Engineer
13 8 (4.32%) Principal Engineer
13 8 (4.32%) Senior Java Engineer
14 7 (3.78%) Applications Engineer
14 7 (3.78%) Operations Engineer
Libraries, Frameworks & Software Standards
1 30 (16.22%) gRPC
1 30 (16.22%) Protocol Buffers
2 10 (5.41%) .NET
2 10 (5.41%) Node.js
2 10 (5.41%) REST
3 8 (4.32%) GraphQL
3 8 (4.32%) Spring
4 7 (3.78%) ARM Templates
5 6 (3.24%) Hibernate
5 6 (3.24%) JSON
6 5 (2.70%) ADO
7 4 (2.16%) CSS
7 4 (2.16%) HTML
7 4 (2.16%) OpenID
7 4 (2.16%) React
7 4 (2.16%) Redux
7 4 (2.16%) SAML
8 3 (1.62%) AWS CDK
8 3 (1.62%) AWS SAM
8 3 (1.62%) Kafka
Miscellaneous
1 36 (19.46%) Hedge funds
2 32 (17.30%) Clustering
3 31 (16.76%) Public Cloud
4 21 (11.35%) Hybrid Cloud
5 17 (9.19%) Cloud Native
6 16 (8.65%) Algorithms
7 15 (8.11%) Data Structures
8 11 (5.95%) Distributed Systems
8 11 (5.95%) Management Information System
9 8 (4.32%) Product Ownership
9 8 (4.32%) Self-Motivation
10 5 (2.70%) Data Centre
11 4 (2.16%) Enterprise Cloud
11 4 (2.16%) Enterprise Software
11 4 (2.16%) Legacy Code
11 4 (2.16%) Team-Oriented Environment
12 3 (1.62%) Client/Server
12 3 (1.62%) Distributed Architecture
12 3 (1.62%) Robotics
13 2 (1.08%) Replication
Operating Systems
1 53 (28.65%) Linux
2 46 (24.86%) Windows
3 13 (7.03%) Windows Server
4 8 (4.32%) Red Hat Enterprise Linux
4 8 (4.32%) Unix
5 5 (2.70%) VMS
6 3 (1.62%) Amazon Linux
6 3 (1.62%) Windows Server 2008
7 2 (1.08%) Oracle Linux
7 2 (1.08%) Solaris
7 2 (1.08%) Windows 10
7 2 (1.08%) Windows Server 2019
8 1 (0.54%) CentOS
8 1 (0.54%) Ubuntu
8 1 (0.54%) Windows Server 2012
8 1 (0.54%) Windows Server 2016
Processes & Methodologies
1 117 (63.24%) DevOps
2 56 (30.27%) Agile
2 56 (30.27%) CI/CD
2 56 (30.27%) Infrastructure as Code
3 48 (25.95%) Software Engineering
4 43 (23.24%) Problem-Solving
5 42 (22.70%) Investment Management
6 41 (22.16%) Mentoring
7 39 (21.08%) Coaching
8 34 (18.38%) Microservices
9 33 (17.84%) Asset Management
10 32 (17.30%) Infrastructure Engineering
11 31 (16.76%) Service Management
12 27 (14.59%) Continuous Improvement
13 26 (14.05%) ITIL
13 26 (14.05%) Migration
14 25 (13.51%) Roadmaps
15 24 (12.97%) Computer Science
16 21 (11.35%) Data Management
16 21 (11.35%) Operational Stability
Programming Languages
1 74 (40.00%) Python
2 65 (35.14%) Java
3 47 (25.41%) Go
4 32 (17.30%) JavaScript
5 28 (15.14%) PowerShell
6 21 (11.35%) Bash
7 19 (10.27%) C#
8 15 (8.11%) SQL
9 10 (5.41%) TypeScript
10 5 (2.70%) C
10 5 (2.70%) Scala
11 4 (2.16%) Shell Script
12 3 (1.62%) C++
13 2 (1.08%) Groovy
13 2 (1.08%) Kotlin
13 2 (1.08%) Ruby
14 1 (0.54%) Bicep
14 1 (0.54%) Perl
Qualifications
1 30 (16.22%) Degree
2 9 (4.86%) Master's Degree
3 8 (4.32%) Computer Science Degree
4 7 (3.78%) Numerate Degree
4 7 (3.78%) Security Cleared
5 6 (3.24%) Azure Certification
6 2 (1.08%) SC Cleared
7 1 (0.54%) BPSS Clearance
7 1 (0.54%) MCP
7 1 (0.54%) Microsoft Certification
Quality Assurance & Compliance
1 13 (7.03%) QA
2 2 (1.08%) GDPR
2 2 (1.08%) HIPAA
2 2 (1.08%) SLA
3 1 (0.54%) ISO/IEC 27001
3 1 (0.54%) NIST
3 1 (0.54%) PCI DSS
System Software
1 52 (28.11%) Docker
2 10 (5.41%) Active Directory
3 9 (4.86%) VMware Infrastructure
4 6 (3.24%) DFS Replication
5 2 (1.08%) Ceph
6 1 (0.54%) Hyper-V
6 1 (0.54%) Microsoft Virtual Server
6 1 (0.54%) Virtual Desktop
6 1 (0.54%) Virtual Servers
6 1 (0.54%) VMware ESXi
Systems Management
1 91 (49.19%) Kubernetes
1 91 (49.19%) Terraform
2 50 (27.03%) Ansible
3 34 (18.38%) Prometheus
4 12 (6.49%) Puppet
5 7 (3.78%) Progress Chef
6 6 (3.24%) Active Directory Federation Services
6 6 (3.24%) NetBackup
6 6 (3.24%) vRealize Orchestrator
7 5 (2.70%) Grafana
8 3 (1.62%) Istio
9 2 (1.08%) Kibana
9 2 (1.08%) Microsoft Intune
9 2 (1.08%) Packer
9 2 (1.08%) Salt
10 1 (0.54%) Consul
10 1 (0.54%) HAProxy
10 1 (0.54%) SCCM
Vendors
1 15 (8.11%) Microsoft
2 12 (6.49%) VMware
3 7 (3.78%) Red Hat
3 7 (3.78%) Veeam
4 6 (3.24%) Citrix
4 6 (3.24%) ServiceNow
5 4 (2.16%) Juniper
5 4 (2.16%) Oracle
6 3 (1.62%) Google
7 2 (1.08%) BMC
7 2 (1.08%) Dynatrace
7 2 (1.08%) Remedy
7 2 (1.08%) SaltStack
7 2 (1.08%) Serena
7 2 (1.08%) Sybase
7 2 (1.08%) TOWER Software
7 2 (1.08%) YouTube
8 1 (0.54%) Arista
8 1 (0.54%) Palo Alto
8 1 (0.54%) Veracode