Software Testing Jobs with Hybrid/Remote/WFH Options

Software Testing
UK > Work from Home

The table below provides summary statistics for permanent remote or hybrid work requiring Software Testing skills. It includes a benchmarking guide to the annual salaries offered in vacancies that cited Software Testing over the 6 months leading up to 1 May 2025, comparing them to the same period in the previous two years.

6 months to
1 May 2025
Same period 2024 Same period 2023
Rank 173 174 166
Rank change year-on-year +1 -8 -27
Permanent jobs citing Software Testing 265 630 916
As % of all permanent jobs with a WFH option 1.77% 1.86% 2.14%
As % of the Processes & Methodologies category 1.90% 2.03% 2.23%
Number of salaries quoted 206 558 657
10th Percentile £37,500 £36,500 £36,250
25th Percentile £46,250 £43,750 £43,250
Median annual salary (50th Percentile) £57,500 £55,000 £57,500
Median % change year-on-year +4.55% -4.35% +9.52%
75th Percentile £71,250 £68,750 £72,500
90th Percentile £87,500 £80,000 £85,000
UK median annual salary £56,500 £50,000 £55,000
% change year-on-year +13.00% -9.09% +4.76%

All Process and Methodology Skills
Work from Home

Software Testing falls under the Processes and Methodologies category. For comparison with the information above, the following table provides summary statistics for all permanent job vacancies with remote or hybrid options requiring process or methodology skills.

Permanent vacancies with a requirement for process or methodology skills 13,930 31,014 41,082
As % of all permanent jobs with a WFH option 93.15% 91.65% 96.09%
Number of salaries quoted 9,709 23,583 28,561
10th Percentile £30,000 £33,930 £37,500
25th Percentile £45,000 £42,500 £47,500
Median annual salary (50th Percentile) £60,000 £57,500 £62,500
Median % change year-on-year +4.35% -8.00% +4.17%
75th Percentile £77,500 £75,000 £82,500
90th Percentile £102,500 £95,000 £100,000
UK median annual salary £57,500 £55,000 £61,500
% change year-on-year +4.55% -10.57% +2.50%

Software Testing
Trend for Jobs with a WFH Option

Job vacancies with remote working options citing Software Testing as a proportion of all IT jobs advertised.
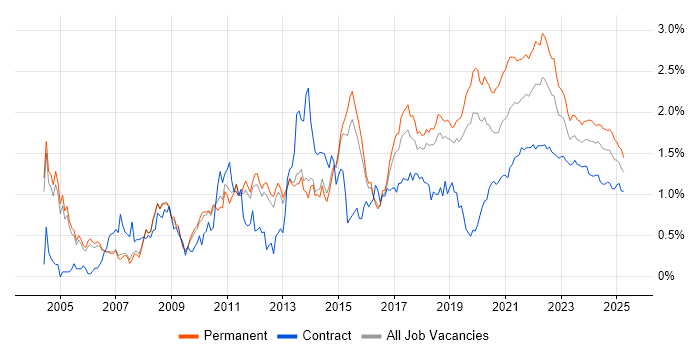
Software Testing trend for jobs with Hybrid/Remote/WFH options

Software Testing
Salary Trend for Jobs with a WFH Option

3-month moving average salary quoted in job vacancies with remote working options citing Software Testing.

Software Testing salary trend for jobs with a WFH option

Software Testing
Salary Histogram for Jobs with a WFH Option

Salary distribution for jobs with remote working options citing Software Testing over the 6 months to 1 May 2025.

Software Testing salary histogram for jobs with a WFH option

Software Testing
Co-occurring Skills and Capabilities with WFH Options by Category

The follow tables expand on the table above by listing co-occurrences grouped by category. The same employment type, locality and period is covered with up to 20 co-occurrences shown in each of the following categories:

Application Platforms
1 2 (0.75%) Confluence
1 2 (0.75%) SharePoint
Applications
1 7 (2.64%) Chatbot
2 5 (1.89%) Simulink
3 4 (1.51%) Microsoft Office
4 3 (1.13%) Microsoft Excel
4 3 (1.13%) Microsoft PowerPoint
5 1 (0.38%) Maple
5 1 (0.38%) MS Visio
Business Applications
1 1 (0.38%) Dynamics CRM
1 1 (0.38%) Elite 3E
1 1 (0.38%) NetSuite
Cloud Services
1 48 (18.11%) Azure
2 33 (12.45%) AWS
3 32 (12.08%) SaaS
4 28 (10.57%) Azure DevOps
5 15 (5.66%) GCP
6 11 (4.15%) GitHub
6 11 (4.15%) Serverless
7 10 (3.77%) AWS Lambda
8 8 (3.02%) GitHub Actions
9 7 (2.64%) Power Automate
10 6 (2.26%) Power Platform
11 4 (1.51%) Cloud Computing
11 4 (1.51%) Figma
12 3 (1.13%) Dynamics 365
13 2 (0.75%) Microsoft 365
14 1 (0.38%) Azure API Management
14 1 (0.38%) Azure Monitor
14 1 (0.38%) BrowserStack
14 1 (0.38%) Datadog
14 1 (0.38%) mabl
Communications & Networking
1 5 (1.89%) HTTP
2 4 (1.51%) Software-Defined Radio
3 3 (1.13%) Internet
4 1 (0.38%) Ethernet
4 1 (0.38%) GSM
4 1 (0.38%) LTE
4 1 (0.38%) Profibus
4 1 (0.38%) Radio Access Network
4 1 (0.38%) SMS
4 1 (0.38%) TCP/IP
4 1 (0.38%) UMTS
Database & Business Intelligence
1 21 (7.92%) PostgreSQL
1 21 (7.92%) SQL Server
2 18 (6.79%) MongoDB
3 16 (6.04%) OLTP
4 13 (4.91%) Elasticsearch
5 10 (3.77%) DynamoDB
6 8 (3.02%) MySQL
7 7 (2.64%) NoSQL
8 6 (2.26%) Redis
8 6 (2.26%) Relational Database
9 4 (1.51%) SQL Server Integration Services
9 4 (1.51%) SQL Server Reporting Services
10 3 (1.13%) Azure SQL Database
10 3 (1.13%) Hazelcast
11 2 (0.75%) Couchbase
11 2 (0.75%) Metadata
11 2 (0.75%) Oracle Database
11 2 (0.75%) Power BI
11 2 (0.75%) RDBMS
12 1 (0.38%) Electronic Patient Records
Development Applications
1 42 (15.85%) Git
2 34 (12.83%) Selenium
3 18 (6.79%) Jenkins
4 17 (6.42%) Appium
4 17 (6.42%) JIRA
5 16 (6.04%) Cypress.io
6 14 (5.28%) Postman
7 11 (4.15%) JUnit
8 9 (3.40%) Maven
9 8 (3.02%) Cucumber
10 7 (2.64%) SpecFlow
11 6 (2.26%) Gradle
11 6 (2.26%) JMeter
11 6 (2.26%) Oracle Forms
11 6 (2.26%) TeamCity
11 6 (2.26%) TestNG
11 6 (2.26%) WebDriver
12 5 (1.89%) SoapUI
13 4 (1.51%) Gatling
13 4 (1.51%) Octopus Deploy
General
1 68 (25.66%) Social Skills
2 32 (12.08%) Finance
3 28 (10.57%) Analytical Skills
4 22 (8.30%) Aerospace
5 13 (4.91%) Banking
6 12 (4.53%) Publishing
7 11 (4.15%) Health Technology
8 10 (3.77%) Inclusion and Diversity
8 10 (3.77%) Tech for Good
9 9 (3.40%) Games
9 9 (3.40%) Law
10 8 (3.02%) Public Sector
11 7 (2.64%) Legal
11 7 (2.64%) Local Government
12 4 (1.51%) Investment Banking
12 4 (1.51%) Organisational Skills
12 4 (1.51%) Presentation Skills
13 3 (1.13%) Influencing Skills
13 3 (1.13%) Marketing
14 2 (0.75%) Manufacturing
Job Titles
1 71 (26.79%) Developer
2 61 (23.02%) Senior
3 39 (14.72%) Senior Developer
4 33 (12.45%) Software Engineer
5 29 (10.94%) Analyst
6 28 (10.57%) Lead
6 28 (10.57%) Tester
7 20 (7.55%) Software Tester
8 18 (6.79%) Software Developer
9 16 (6.04%) Oracle Developer
9 16 (6.04%) Senior Oracle Developer
9 16 (6.04%) Test Engineer
10 14 (5.28%) Senior Software Developer
11 13 (4.91%) Software Analyst
12 12 (4.53%) Business Analyst
12 12 (4.53%) PL/SQL Developer
12 12 (4.53%) QA Engineer
12 12 (4.53%) Senior PL/SQL Developer
12 12 (4.53%) Senior SQL Developer
12 12 (4.53%) SQL Developer
Libraries, Frameworks & Software Standards
1 53 (20.00%) .NET
2 37 (13.96%) React
3 30 (11.32%) HTML
4 27 (10.19%) Kafka
5 22 (8.30%) AngularJS
6 21 (7.92%) SOAP
7 20 (7.55%) RESTful
8 19 (7.17%) REST
8 19 (7.17%) XML
9 18 (6.79%) .NET Framework
9 18 (6.79%) Node.js
10 17 (6.42%) Playwright
11 16 (6.04%) Web Services
12 14 (5.28%) ASP.NET
13 13 (4.91%) Entity Framework
13 13 (4.91%) jQuery
13 13 (4.91%) Qt
13 13 (4.91%) Swagger
14 12 (4.53%) .NET Core
14 12 (4.53%) ASP.NET MVC
Miscellaneous
1 32 (12.08%) Product Ownership
2 22 (8.30%) Cloud Native
3 20 (7.55%) Mobile App
4 14 (5.28%) Embedded Systems
5 10 (3.77%) Algorithms
5 10 (3.77%) Onboarding
6 9 (3.40%) Distributed Systems
7 7 (2.64%) Robotics
7 7 (2.64%) Virtual Team
8 6 (2.26%) Legacy Systems
8 6 (2.26%) Mobile Games
9 5 (1.89%) FPGA
10 4 (1.51%) Analytical Mindset
11 3 (1.13%) e-Learning
11 3 (1.13%) Management Information System
11 3 (1.13%) Self-Motivation
12 2 (0.75%) Data Centre
12 2 (0.75%) Low-Code
12 2 (0.75%) NHS
12 2 (0.75%) Team-Oriented Environment
Operating Systems
1 28 (10.57%) Linux
2 16 (6.04%) Apple iOS
3 12 (4.53%) Android
3 12 (4.53%) Unix
3 12 (4.53%) Windows
4 2 (0.75%) Mac OS
4 2 (0.75%) VMS
5 1 (0.38%) Embedded Linux
Processes & Methodologies
1 114 (43.02%) Agile
2 110 (41.51%) Test Automation
3 68 (25.66%) Problem-Solving
4 57 (21.51%) Software Engineering
5 50 (18.87%) Manual Testing
6 48 (18.11%) SDLC
7 46 (17.36%) DevOps
8 45 (16.98%) CI/CD
9 44 (16.60%) Regression Testing
10 33 (12.45%) Validation
11 32 (12.08%) Mentoring
12 30 (11.32%) Microservices
12 30 (11.32%) Scrum
13 28 (10.57%) Continuous Improvement
14 27 (10.19%) Test Strategy
15 26 (9.81%) Test Scripting
16 23 (8.68%) Project Management
17 22 (8.30%) Computer Science
18 21 (7.92%) SDET
19 20 (7.55%) Integration Testing
Programming Languages
1 78 (29.43%) SQL
2 72 (27.17%) JavaScript
3 66 (24.91%) Python
4 59 (22.26%) C#
5 40 (15.09%) TypeScript
6 35 (13.21%) C++
7 34 (12.83%) Java
8 27 (10.19%) C
9 26 (9.81%) PL/SQL
10 15 (5.66%) Bash
11 10 (3.77%) Fortran
12 7 (2.64%) VB.NET
13 5 (1.89%) MATLAB
14 4 (1.51%) Swift
15 3 (1.13%) PHP
15 3 (1.13%) PowerShell
15 3 (1.13%) Ruby
16 2 (0.75%) Scala
16 2 (0.75%) Shell Script
16 2 (0.75%) T-SQL
Qualifications
1 38 (14.34%) Degree
2 26 (9.81%) Security Cleared
3 25 (9.43%) SC Cleared
4 24 (9.06%) ISTQB
5 13 (4.91%) Master's Degree
6 11 (4.15%) PhD
7 8 (3.02%) Computer Science Degree
7 8 (3.02%) DV Cleared
8 6 (2.26%) AWS Certification
8 6 (2.26%) AWS Certified Solutions Architect
8 6 (2.26%) ISTQB Foundation Certification
9 3 (1.13%) Azure Certification
9 3 (1.13%) Microsoft Certification
10 2 (0.75%) ISEB
11 1 (0.38%) BPSS Clearance
11 1 (0.38%) CISSP
11 1 (0.38%) CSQA
11 1 (0.38%) MCSD
Quality Assurance & Compliance
1 102 (38.49%) QA
2 6 (2.26%) Def Stans
3 5 (1.89%) Accessibility
4 3 (1.13%) PMBOK
5 2 (0.75%) ISO 9001
6 1 (0.38%) Software Quality Assurance
System Software
1 28 (10.57%) Docker
2 4 (1.51%) Firmware
3 1 (0.38%) Embedded Firmware
Systems Management
1 33 (12.45%) Kubernetes
2 10 (3.77%) Argo
3 6 (2.26%) Prometheus
4 3 (1.13%) Ansible
4 3 (1.13%) Rundeck
5 1 (0.38%) HP Quality Center
5 1 (0.38%) Terraform
Vendors
1 28 (10.57%) Oracle
2 26 (9.81%) Microsoft
3 8 (3.02%) UiPath
4 7 (2.64%) Google
5 6 (2.26%) IBM
5 6 (2.26%) New Relic
5 6 (2.26%) VMware
6 4 (1.51%) Xilinx
7 3 (1.13%) Salesforce
7 3 (1.13%) Splunk
8 2 (0.75%) CA Agile Central
8 2 (0.75%) Dynatrace
9 1 (0.38%) Allen-Bradley
9 1 (0.38%) Lotus
9 1 (0.38%) SAP
9 1 (0.38%) Siemens
9 1 (0.38%) Xamarin