C# Jobs with Work from Home Options

C#
UK > Work from Home

The table below provides summary statistics for permanent remote or hybrid work requiring C# skills. It includes a benchmarking guide to the annual salaries offered in vacancies that cited C# over the 6 months leading up to 26 July 2024, comparing them to the same period in the previous two years.

6 months to
26 Jul 2024
Same period 2023 Same period 2022
Rank 19 16 20
Rank change year-on-year -3 +4 -7
Permanent jobs citing C# 2,619 3,993 9,728
As % of all permanent jobs with a WFH option 9.37% 12.17% 12.39%
As % of the Programming Languages category 24.47% 26.31% 21.37%
Number of salaries quoted 2,211 3,227 6,252
10th Percentile £38,084 £40,000 £37,500
25th Percentile £45,000 £48,750 £45,000
Median annual salary (50th Percentile) £55,000 £60,000 £57,500
Median % change year-on-year -8.33% +4.35% +9.52%
75th Percentile £70,000 £78,750 £72,500
90th Percentile £85,000 £95,000 £87,500
UK median annual salary £57,500 £62,500 £59,500
% change year-on-year -8.00% +5.04% +8.18%

All Programming Languages
Work from Home

C# falls under the Programming Languages category. For comparison with the information above, the following table provides summary statistics for all permanent job vacancies with remote or hybrid options requiring coding skills.

Permanent vacancies with a requirement for coding skills 10,703 15,175 45,514
As % of all permanent jobs with a WFH option 38.31% 46.24% 57.96%
Number of salaries quoted 8,410 12,366 24,728
10th Percentile £39,000 £40,500 £38,443
25th Percentile £46,923 £50,000 £46,250
Median annual salary (50th Percentile) £60,918 £65,000 £62,500
Median % change year-on-year -6.28% +4.00% +13.64%
75th Percentile £82,500 £85,000 £82,500
90th Percentile £110,000 £105,000 £95,000
UK median annual salary £60,000 £65,000 £62,500
% change year-on-year -7.69% +4.00% +8.70%

C#
Trend for Jobs with a WFH Option

Job vacancies with a work from home option citing C# as a proportion of all IT jobs advertised.
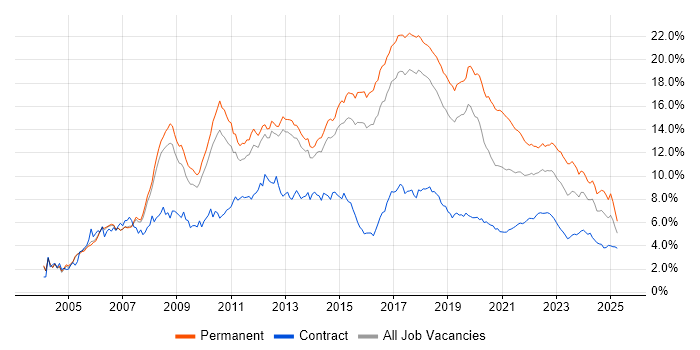
C# trend for jobs with a WFH option

C#
Salary Trend for Jobs with a WFH Option

3-month moving average salary quoted in job vacancies with a work from home option citing C#.

C# salary trend for jobs with a WFH option

C#
Salary Histogram for Jobs with a WFH Option

Salary distribution for jobs with a work from home option citing C# over the 6 months to 26 July 2024.

C# salary histogram for jobs with a WFH option

C#
Co-occurring Skills and Capabilities with WFH Options by Category

The follow tables expand on the table above by listing co-occurrences grouped by category. The same employment type, locality and period is covered with up to 20 co-occurrences shown in each of the following categories:

Application Platforms
1 121 (4.62%) IIS
2 94 (3.59%) SharePoint
3 70 (2.67%) ArcGIS
4 64 (2.44%) GeoServer
5 56 (2.14%) CMS
6 49 (1.87%) Umbraco
7 38 (1.45%) Microsoft Exchange
8 34 (1.30%) Sitecore CMS
9 29 (1.11%) Kentico
10 27 (1.03%) Apache
11 26 (0.99%) Headless CMS
12 15 (0.57%) NServiceBus
13 14 (0.53%) Apache Airflow
14 9 (0.34%) Confluence
15 7 (0.27%) Apache Solr
15 7 (0.27%) nginx
16 6 (0.23%) Apache Spark
17 3 (0.11%) BizTalk Server
17 3 (0.11%) EPiServer
18 2 (0.076%) Immediacy CMS
Applications
1 19 (0.73%) Microsoft Excel
2 10 (0.38%) Microsoft Office
3 4 (0.15%) MS Visio
4 3 (0.11%) Adobe Illustrator
4 3 (0.11%) Fusion 360
4 3 (0.11%) Revit
4 3 (0.11%) S-PLUS
5 2 (0.076%) AutoCAD
5 2 (0.076%) Autodesk Inventor
5 2 (0.076%) PrintSoft PReS
6 1 (0.038%) Mathematica
6 1 (0.038%) Sketch
6 1 (0.038%) SOLIDWORKS
6 1 (0.038%) UXPin
6 1 (0.038%) Zeplin
Business Applications
1 88 (3.36%) Dynamics CRM
2 14 (0.53%) Payment Gateway
3 13 (0.50%) Oracle Receivables
4 6 (0.23%) Sage 200
4 6 (0.23%) Sage 50
5 3 (0.11%) SystmOne
6 2 (0.076%) SAP MII
7 1 (0.038%) DELMIA
7 1 (0.038%) Magento
7 1 (0.038%) nopCommerce
7 1 (0.038%) Salesforce CRM
7 1 (0.038%) Scribe Insight
7 1 (0.038%) Shopify
7 1 (0.038%) Visualfiles
Cloud Services
1 1,503 (57.39%) Azure
2 508 (19.40%) AWS
3 378 (14.43%) Azure DevOps
4 215 (8.21%) Power Platform
5 164 (6.26%) SaaS
6 149 (5.69%) Dynamics 365
7 125 (4.77%) PowerApps
8 120 (4.58%) Power Automate
9 107 (4.09%) Serverless
10 105 (4.01%) Microsoft 365
11 75 (2.86%) GCP
12 70 (2.67%) Azure Service Bus
13 57 (2.18%) Azure Logic Apps
14 52 (1.99%) Azure Functions
14 52 (1.99%) GitHub
15 46 (1.76%) Entra ID
16 43 (1.64%) Azure Monitor
17 41 (1.57%) Azure Cosmos DB
18 32 (1.22%) AWS Lambda
19 27 (1.03%) Azure Storage
Communications & Networking
1 46 (1.76%) DNS
2 44 (1.68%) Firewall
3 30 (1.15%) TCP/IP
4 28 (1.07%) Internet
5 20 (0.76%) DHCP
5 20 (0.76%) SSL
6 16 (0.61%) Network Security
7 7 (0.27%) Broadband
7 7 (0.27%) Mobile Broadband
8 6 (0.23%) VPN
9 5 (0.19%) RS-232
10 4 (0.15%) CTI
10 4 (0.15%) Ethernet
11 3 (0.11%) GPRS
11 3 (0.11%) Hyperconnected
11 3 (0.11%) Intranet
11 3 (0.11%) Modbus
11 3 (0.11%) OpenVPN
12 2 (0.076%) Multicast
12 2 (0.076%) Wireless
Database & Business Intelligence
1 791 (30.20%) SQL Server
2 138 (5.27%) PostgreSQL
3 127 (4.85%) MongoDB
4 117 (4.47%) Relational Database
5 98 (3.74%) Power BI
6 90 (3.44%) Azure SQL Database
7 82 (3.13%) Elasticsearch
8 72 (2.75%) MySQL
9 70 (2.67%) GIS
10 64 (2.44%) QGIS
11 53 (2.02%) NoSQL
12 41 (1.57%) SQL Server Integration Services
13 37 (1.41%) Redis
14 29 (1.11%) SQL Server Reporting Services
15 26 (0.99%) Data Warehouse
16 24 (0.92%) DynamoDB
17 12 (0.46%) Amazon RDS
18 11 (0.42%) Big Data
19 10 (0.38%) Dremio
19 10 (0.38%) Tableau
Development Applications
1 224 (8.55%) Git
2 152 (5.80%) Visual Studio
3 61 (2.33%) Team Foundation Server
4 60 (2.29%) Selenium
5 51 (1.95%) Jenkins
5 51 (1.95%) JIRA
6 44 (1.68%) TeamCity
7 42 (1.60%) SpecFlow
8 35 (1.34%) Jasmine
9 28 (1.07%) Karma Test Runner
9 28 (1.07%) Postman
10 27 (1.03%) Octopus Deploy
11 24 (0.92%) NUnit
12 21 (0.80%) Cucumber
13 17 (0.65%) JMeter
14 15 (0.57%) MSBuild
15 14 (0.53%) GitLab
15 14 (0.53%) Moq
16 13 (0.50%) PowerBuilder
17 12 (0.46%) Visual Studio Team System
General
1 503 (19.21%) Social Skills
2 424 (16.19%) Finance
3 178 (6.80%) Analytical Skills
4 108 (4.12%) Inclusion and Diversity
5 105 (4.01%) Public Sector
6 100 (3.82%) Retail
7 74 (2.83%) Law
8 64 (2.44%) Marketing
9 56 (2.14%) Manufacturing
10 54 (2.06%) Games
11 53 (2.02%) Back Office
12 48 (1.83%) Front Office
13 47 (1.79%) Legal
14 37 (1.41%) Banking
15 30 (1.15%) Tech for Good
16 29 (1.11%) Automotive
17 26 (0.99%) Advertising
17 26 (0.99%) Electronics
18 21 (0.80%) Telecoms
19 19 (0.73%) Music Industry
Job Titles
1 1,587 (60.60%) Developer
2 740 (28.26%) .NET Developer
3 629 (24.02%) Senior
4 525 (20.05%) C# Developer
5 464 (17.72%) Software Engineer
6 409 (15.62%) Software Developer
7 367 (14.01%) Senior Developer
8 311 (11.87%) C# .NET Developer
9 232 (8.86%) Lead
10 225 (8.59%) Senior Software Engineer
11 180 (6.87%) Full Stack Developer
12 177 (6.76%) Senior .NET Developer
13 164 (6.26%) C# Software Developer
14 130 (4.96%) Architect
15 125 (4.77%) Lead Developer
16 121 (4.62%) .NET Software Developer
17 117 (4.47%) Senior C# Developer
18 97 (3.70%) .NET Software Engineer
19 95 (3.63%) C# Software Engineer
20 88 (3.36%) Senior Software Developer
Libraries, Frameworks & Software Standards
1 1,965 (75.03%) .NET
2 682 (26.04%) .NET Core
3 632 (24.13%) ASP.NET
4 574 (21.92%) AngularJS
5 537 (20.50%) React
6 501 (19.13%) HTML
7 499 (19.05%) .NET Framework
8 481 (18.37%) CSS
9 327 (12.49%) ASP.NET MVC
10 305 (11.65%) Entity Framework
11 254 (9.70%) ASP.NET Web API
12 230 (8.78%) Vue
13 205 (7.83%) REST
14 203 (7.75%) RESTful
15 193 (7.37%) Web Services
16 162 (6.19%) HTML5
17 153 (5.84%) Node.js
18 139 (5.31%) Blazor
19 104 (3.97%) Twitter Bootstrap
20 103 (3.93%) XML
Miscellaneous
1 111 (4.24%) Greenfield Project
2 95 (3.63%) Product Ownership
3 92 (3.51%) Self-Motivation
4 74 (2.83%) Enterprise Software
5 69 (2.63%) Mobile App
6 63 (2.41%) Cloud Native
7 53 (2.02%) Onboarding
8 51 (1.95%) Derivative
9 44 (1.68%) Foreign Exchange (FX)
9 44 (1.68%) Hedge funds
10 41 (1.57%) Client/Server
10 41 (1.57%) Equities
11 39 (1.49%) Fixed Income
12 34 (1.30%) Data Structures
13 25 (0.95%) Algorithms
13 25 (0.95%) Low-Code
14 24 (0.92%) Legacy Systems
15 22 (0.84%) NHS
16 21 (0.80%) Enterprise Cloud
17 20 (0.76%) PKI
Operating Systems
1 172 (6.57%) Windows
2 97 (3.70%) Linux
3 48 (1.83%) Android
4 39 (1.49%) Apple iOS
5 33 (1.26%) Windows Server
6 22 (0.84%) AIX
7 19 (0.73%) Windows Server 2019
8 16 (0.61%) Windows Server 2016
9 10 (0.38%) Oracle Linux
9 10 (0.38%) Red Hat Enterprise Linux
9 10 (0.38%) Solaris
10 5 (0.19%) Embedded Linux
11 4 (0.15%) Ubuntu
11 4 (0.15%) Windows 10
11 4 (0.15%) Windows 7
12 3 (0.11%) CentOS
12 3 (0.11%) Mac OS
12 3 (0.11%) Windows Embedded Compact
13 2 (0.076%) Unix
13 2 (0.076%) Windows Mobile
Processes & Methodologies
1 1,109 (42.34%) Agile
2 785 (29.97%) Software Engineering
3 673 (25.70%) DevOps
4 585 (22.34%) Full Stack Development
5 491 (18.75%) MVC
6 471 (17.98%) Problem-Solving
7 378 (14.43%) Microservices
8 363 (13.86%) CI/CD
9 355 (13.55%) TDD
10 310 (11.84%) Scrum
11 238 (9.09%) Computer Science
12 235 (8.97%) Web Development
13 224 (8.55%) Unit Testing
14 210 (8.02%) Mentoring
15 197 (7.52%) OO
16 195 (7.45%) Design Patterns
16 195 (7.45%) Test Automation
17 184 (7.03%) SDLC
18 180 (6.87%) Continuous Integration
19 167 (6.38%) BDD
Programming Languages
1 1,045 (39.90%) JavaScript
2 894 (34.14%) SQL
3 335 (12.79%) Python
4 323 (12.33%) TypeScript
5 162 (6.19%) Java
6 144 (5.50%) C++
7 139 (5.31%) VB.NET
8 109 (4.16%) T-SQL
9 106 (4.05%) PowerShell
10 98 (3.74%) C
11 97 (3.70%) VB
12 42 (1.60%) Bicep
13 34 (1.30%) PHP
14 29 (1.11%) VB6
15 26 (0.99%) XAML
16 25 (0.95%) VBScript
17 23 (0.88%) Bash
17 23 (0.88%) Go
18 17 (0.65%) PL/SQL
19 13 (0.50%) VBA
Qualifications
1 361 (13.78%) Degree
2 212 (8.09%) Security Cleared
3 146 (5.57%) Computer Science Degree
4 145 (5.54%) SC Cleared
5 48 (1.83%) Microsoft Certification
6 33 (1.26%) DV Cleared
7 30 (1.15%) BPSS Clearance
8 27 (1.03%) DBS Check
9 21 (0.80%) Azure Certification
10 16 (0.61%) ITIL Foundation Certificate
10 16 (0.61%) Master's Degree
11 15 (0.57%) ISTQB
12 8 (0.31%) CIPD
12 8 (0.31%) ITIL Certification
13 6 (0.23%) MCSE
14 5 (0.19%) AWS Certification
14 5 (0.19%) PhD
15 4 (0.15%) CCNA
15 4 (0.15%) CCNP
15 4 (0.15%) Cisco Certification
Quality Assurance & Compliance
1 155 (5.92%) QA
2 54 (2.06%) Accessibility
3 15 (0.57%) GDPR
4 9 (0.34%) SLA
5 8 (0.31%) WCAG
6 5 (0.19%) ISO/IEC 27001
7 4 (0.15%) EMIR
7 4 (0.15%) MiFID
8 2 (0.076%) ISO 9001
8 2 (0.076%) PMO
9 1 (0.038%) AQAP
9 1 (0.038%) Cyber Essentials
9 1 (0.038%) TickIT
System Software
1 189 (7.22%) Docker
2 43 (1.64%) Active Directory
3 33 (1.26%) Virtual Machines
4 18 (0.69%) Virtual Desktop
5 7 (0.27%) Firmware
6 6 (0.23%) VMware Infrastructure
7 4 (0.15%) Microsoft App-V
8 3 (0.11%) Hyper-V
8 3 (0.11%) KVM
8 3 (0.11%) VMware ESXi
8 3 (0.11%) vSphere
9 2 (0.076%) VMware Server
10 1 (0.038%) Ceph
10 1 (0.038%) Embedded Firmware
Systems Management
1 157 (5.99%) Kubernetes
2 61 (2.33%) Terraform
3 21 (0.80%) Active Directory Federation Services
4 20 (0.76%) SCCM
4 20 (0.76%) WSUS
5 17 (0.65%) Ansible
6 16 (0.61%) Microsoft Intune
6 16 (0.61%) SCOM
7 15 (0.57%) Grafana
7 15 (0.57%) Prometheus
8 8 (0.31%) MIIS
9 4 (0.15%) Istio
10 3 (0.11%) Kibana
10 3 (0.11%) Progress Chef
10 3 (0.11%) Puppet
11 1 (0.038%) Consul
11 1 (0.038%) Oracle Identity Management
11 1 (0.038%) Packer
11 1 (0.038%) Salt
Vendors
1 840 (32.07%) Microsoft
2 89 (3.40%) Oracle
3 68 (2.60%) ESRI
4 49 (1.87%) Google
5 37 (1.41%) Xamarin
6 36 (1.37%) Sitecore
7 29 (1.11%) Optimizely
8 20 (0.76%) Facebook
9 17 (0.65%) Salesforce
10 14 (0.53%) SAP
10 14 (0.53%) YouTube
11 13 (0.50%) BT
11 13 (0.50%) Twitter
12 12 (0.46%) Apple
12 12 (0.46%) UiPath
13 10 (0.38%) Databricks
13 10 (0.38%) Serena
13 10 (0.38%) VMware
14 8 (0.31%) DevExpress
15 7 (0.27%) Sony