Hybrid/Remote Node.js Job Trends

Node
UK > Work from Home

The table below provides summary statistics and salary benchmarking for remote or hybrid work requiring Node.js skills. It covers vacancies from the 6 months leading up to 16 September 2025, with comparisons to the same periods in the previous two years.

6 months to
16 Sep 2025
Same period 2024 Same period 2023
Rank 96 121 76
Rank change year-on-year +25 -45 -40
Permanent jobs citing Node.js 608 623 988
As % of all permanent jobs with a WFH option 3.75% 2.68% 3.94%
As % of the Libraries, Frameworks & Software Standards category 16.99% 10.05% 12.27%
Number of salaries quoted 337 428 885
10th Percentile £42,500 £45,000 £45,000
25th Percentile £63,750 £52,500 £58,750
Median annual salary (50th Percentile) £90,000 £67,500 £75,000
Median % change year-on-year +33.33% -10.00% +7.14%
75th Percentile £132,500 £83,750 £95,000
90th Percentile £137,500 £108,750 £117,236
UK median annual salary £80,000 £65,000 £75,000
% change year-on-year +23.08% -13.33% +7.14%

All Software Libraries and Frameworks
Work from Home

Node.js falls under the Software Libraries and Frameworks category. For comparison with the information above, the following table provides summary statistics for all permanent job vacancies with remote or hybrid options requiring technical specification, industry standards, software libraries and framework skills.

Permanent vacancies with a requirement for technical specification, industry standards, software libraries and framework skills 3,579 6,198 8,051
As % of all permanent jobs with a WFH option 22.10% 26.63% 32.09%
Number of salaries quoted 2,345 4,447 7,003
10th Percentile £38,750 £40,000 £42,500
25th Percentile £51,250 £47,500 £51,250
Median annual salary (50th Percentile) £67,500 £65,000 £65,000
Median % change year-on-year +3.85% - -
75th Percentile £87,500 £87,500 £85,000
90th Percentile £122,500 £122,500 £102,500
UK median annual salary £67,500 £64,244 £66,056
% change year-on-year +5.07% -2.74% +1.62%

Node.js
Trend for Jobs with a WFH Option

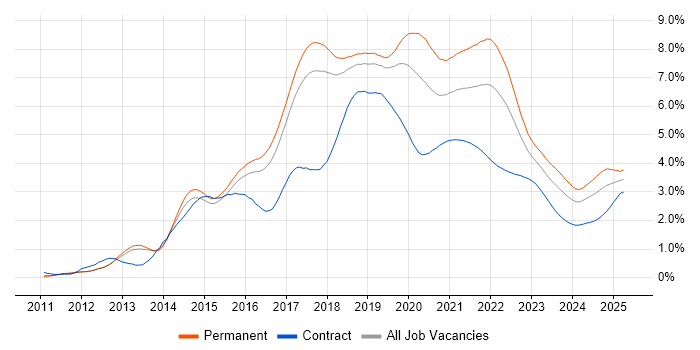
Job vacancies with remote working options citing Node.js as a proportion of all IT jobs advertised.

Node.js trend for jobs with Hybrid/Remote/WFH options

Node.js
Salary Trend for Jobs with Hybrid Work Options

Salary distribution trend for jobs with remote work options citing Node.js.

Salary distribution trend for jobs with remote work options citing Node.js

Node.js
Salary Histogram for Jobs with a WFH Option

Salary distribution for jobs with remote working options citing Node.js over the 6 months to 16 September 2025.

Node.js salary histogram for jobs with a WFH option

Node.js
Co-occurring Skills and Capabilities with WFH Options by Category

The follow tables expand on the table above by listing co-occurrences grouped by category. The same employment type, locality and period is covered with up to 20 co-occurrences shown in each of the following categories:

Application Platforms
1 95 (15.63%) Apache Airflow
2 13 (2.14%) Headless CMS
3 10 (1.64%) Confluence
4 7 (1.15%) CMS
5 4 (0.66%) nginx
6 3 (0.49%) Apache Solr
7 2 (0.33%) Drupal
7 2 (0.33%) EPiServer
7 2 (0.33%) SharePoint
7 2 (0.33%) Solana
7 2 (0.33%) Umbraco
8 1 (0.16%) Apache
Applications
1 10 (1.64%) Chatbot
2 2 (0.33%) Photoshop
Business Applications
1 14 (2.30%) Shopify
2 4 (0.66%) Payment Gateway
3 1 (0.16%) SAP S/4HANA
Cloud Services
1 487 (80.10%) AWS
2 318 (52.30%) Azure
3 315 (51.81%) GCP
4 95 (15.63%) dbt
5 52 (8.55%) Amazon EKS
6 50 (8.22%) AWS CloudFormation
7 30 (4.93%) Serverless
8 26 (4.28%) GitHub
9 19 (3.13%) SaaS
10 18 (2.96%) AWS Lambda
11 13 (2.14%) GitHub Actions
12 12 (1.97%) Figma
13 10 (1.64%) Amazon S3
13 10 (1.64%) Amazon SQS
13 10 (1.64%) Vercel
14 8 (1.32%) Amazon ECS
14 8 (1.32%) Azure DevOps
14 8 (1.32%) Azure Service Bus
14 8 (1.32%) Google Analytics
14 8 (1.32%) PaaS
Communications & Networking
1 6 (0.99%) Broadband
2 3 (0.49%) DHCP
2 3 (0.49%) DNS
2 3 (0.49%) Firewall
2 3 (0.49%) Internet
2 3 (0.49%) STUN
2 3 (0.49%) TCP/IP
2 3 (0.49%) VLAN
2 3 (0.49%) VoIP
2 3 (0.49%) VoLTE
2 3 (0.49%) Wireshark
Database & Business Intelligence
1 138 (22.70%) PostgreSQL
2 95 (15.63%) Amazon Athena
2 95 (15.63%) Apache Arrow
2 95 (15.63%) Apache Iceberg
2 95 (15.63%) Dremio
3 82 (13.49%) Elasticsearch
4 67 (11.02%) MongoDB
5 34 (5.59%) NoSQL
6 32 (5.26%) MySQL
7 28 (4.61%) Redis
8 25 (4.11%) Azure SQL Database
9 16 (2.63%) SQL Server
10 8 (1.32%) DynamoDB
11 7 (1.15%) Relational Database
12 5 (0.82%) Metadata
13 3 (0.49%) BigQuery
13 3 (0.49%) Couchbase
13 3 (0.49%) Hazelcast
13 3 (0.49%) SQL Server Integration Services
13 3 (0.49%) SQL Server Reporting Services
Development Applications
1 47 (7.73%) Git
2 22 (3.62%) JIRA
3 13 (2.14%) Cypress.io
4 10 (1.64%) Jenkins
5 9 (1.48%) TeamCity
6 7 (1.15%) GitLab
6 7 (1.15%) webpack
7 5 (0.82%) gulp
7 5 (0.82%) Selenium
8 3 (0.49%) Babel
8 3 (0.49%) CircleCI
8 3 (0.49%) JMeter
8 3 (0.49%) Postman
8 3 (0.49%) Visual Studio
8 3 (0.49%) Visual Studio Code
9 2 (0.33%) Grunt
9 2 (0.33%) Mocha
9 2 (0.33%) Octopus Deploy
9 2 (0.33%) Spock
10 1 (0.16%) Artifactory
General
1 228 (37.50%) Inclusion and Diversity
2 153 (25.16%) Finance
3 132 (21.71%) Front Office
4 76 (12.50%) Social Skills
5 75 (12.34%) Analytical Skills
6 24 (3.95%) Law
7 14 (2.30%) Banking
7 14 (2.30%) Retail
8 12 (1.97%) Marketing
9 11 (1.81%) Games
10 8 (1.32%) iGaming
10 8 (1.32%) Telecoms
11 7 (1.15%) Advertising
12 3 (0.49%) Fire and Rescue
12 3 (0.49%) Health Technology
12 3 (0.49%) Tech for Good
13 2 (0.33%) Multimedia
14 1 (0.16%) Public Sector
14 1 (0.16%) Retail Banking
Job Titles
1 338 (55.59%) Software Engineer
2 315 (51.81%) Developer
3 233 (38.32%) Senior
4 184 (30.26%) Senior Software Engineer
5 132 (21.71%) Developer/Software Engineer
6 100 (16.45%) AWS Developer
7 95 (15.63%) AWS Engineer
7 95 (15.63%) AWS Software Engineer
8 74 (12.17%) Python Developer
9 71 (11.68%) Python Engineer
9 71 (11.68%) Python Software Engineer
10 67 (11.02%) Software Developer
11 44 (7.24%) Full-Stack Developer
12 40 (6.58%) Lead
13 38 (6.25%) React Developer
14 35 (5.76%) Senior Developer
15 32 (5.26%) .NET Developer
15 32 (5.26%) Java Engineer
15 32 (5.26%) Java Software Engineer
16 31 (5.10%) Java Developer
Libraries, Frameworks & Software Standards
1 286 (47.04%) React
2 275 (45.23%) .NET
3 144 (23.68%) Pandas
4 140 (23.03%) Vue
5 136 (22.37%) AngularJS
6 95 (15.63%) NumPy
6 95 (15.63%) SciPy
7 57 (9.38%) Redux
8 55 (9.05%) HTML
9 54 (8.88%) GraphQL
10 51 (8.39%) CSS
11 34 (5.59%) .NET Core
12 33 (5.43%) React Native
13 32 (5.26%) Kafka
14 29 (4.77%) Next.js
15 24 (3.95%) .NET Framework
15 24 (3.95%) ASP.NET
15 24 (3.95%) Entity Framework
15 24 (3.95%) RESTful
16 21 (3.45%) REST
Miscellaneous
1 227 (37.34%) Cyberattack
2 184 (30.26%) Self-Motivation
3 179 (29.44%) Linux Command Line
4 132 (21.71%) Fixed Income
5 104 (17.11%) Equities
5 104 (17.11%) Foreign Exchange (FX)
6 27 (4.44%) Mobile App
7 18 (2.96%) Cloud Native
8 13 (2.14%) Data Centre
9 12 (1.97%) Management Information System
10 10 (1.64%) Distributed Systems
11 8 (1.32%) Product Ownership
12 7 (1.15%) Mobile Games
13 6 (0.99%) Public Cloud
14 4 (0.66%) Greenfield Project
14 4 (0.66%) Hackathon
15 3 (0.49%) Media Streaming
15 3 (0.49%) Smart City
15 3 (0.49%) Sports Betting
16 2 (0.33%) Graphic Design
Operating Systems
1 247 (40.63%) Linux
2 50 (8.22%) Android
3 13 (2.14%) Windows
4 4 (0.66%) Ubuntu
4 4 (0.66%) Windows Server
5 3 (0.49%) Unix
6 1 (0.16%) Apple iOS
Processes & Methodologies
1 474 (77.96%) Agile
2 427 (70.23%) Software Engineering
3 230 (37.83%) Microservices
4 219 (36.02%) User Experience
5 215 (35.36%) Scrum
6 214 (35.20%) Mentoring
7 195 (32.07%) Machine Learning
8 183 (30.10%) Cloud Security
9 180 (29.61%) Data Engineering
10 179 (29.44%) Site Reliability Engineering
11 132 (21.71%) Investment Management
12 124 (20.39%) Fintech
13 119 (19.57%) Order Management
14 115 (18.91%) Asset Management
15 113 (18.59%) Full-Stack Development
16 109 (17.93%) CI/CD
17 95 (15.63%) Performance Attribution
17 95 (15.63%) Risk Management
18 74 (12.17%) Kanban
19 65 (10.69%) Problem-Solving
Programming Languages
1 497 (81.74%) JavaScript
2 369 (60.69%) Python
3 294 (48.36%) Java
4 259 (42.60%) TypeScript
5 254 (41.78%) Go
6 228 (37.50%) C++
7 227 (37.34%) Rust
8 69 (11.35%) SQL
9 44 (7.24%) C#
10 8 (1.32%) PHP
11 5 (0.82%) PowerShell
11 5 (0.82%) R
12 3 (0.49%) Bash
12 3 (0.49%) Ruby
13 2 (0.33%) Groovy
14 1 (0.16%) ABAP
Qualifications
1 249 (40.95%) Security Cleared
2 228 (37.50%) DV Cleared
3 180 (29.61%) AWS Certification
3 180 (29.61%) AWS Certified Developer
4 178 (29.28%) AWS Certified Solutions Architect
5 31 (5.10%) Degree
6 22 (3.62%) Computer Science Degree
7 21 (3.45%) SC Cleared
8 3 (0.49%) Azure Certification
8 3 (0.49%) CCNP
8 3 (0.49%) Cisco Certification
8 3 (0.49%) ITIL Foundation Certificate
8 3 (0.49%) Master's Degree
8 3 (0.49%) Microsoft Certification
9 1 (0.16%) SAP Certification
Quality Assurance & Compliance
1 28 (4.61%) QA
2 17 (2.80%) Accessibility
3 12 (1.97%) ISO/IEC 27001
4 6 (0.99%) GDPR
5 4 (0.66%) PCI DSS
6 3 (0.49%) SOC 2
6 3 (0.49%) WCAG
System Software
1 80 (13.16%) Docker
2 8 (1.32%) VMware Infrastructure
3 7 (1.15%) Virtual Machines
3 7 (1.15%) vSphere
4 3 (0.49%) Firmware
5 1 (0.16%) KVM
5 1 (0.16%) Xen
Systems Management
1 74 (12.17%) Kubernetes
2 67 (11.02%) Terraform
3 58 (9.54%) Ansible
4 3 (0.49%) Grafana
4 3 (0.49%) Prometheus
5 2 (0.33%) Argo
6 1 (0.16%) CFEngine
6 1 (0.16%) Docker Swarm
6 1 (0.16%) Kibana
6 1 (0.16%) logstash
6 1 (0.16%) Progress Chef
6 1 (0.16%) Puppet
Vendors
1 38 (6.25%) Microsoft
2 8 (1.32%) Apple
2 8 (1.32%) VMware
3 7 (1.15%) Google
4 6 (0.99%) Sage
5 4 (0.66%) OpenAI
6 3 (0.49%) Dynatrace
6 3 (0.49%) Gigya
6 3 (0.49%) Oracle
6 3 (0.49%) PayPal
7 2 (0.33%) Guidewire
7 2 (0.33%) Salesforce
8 1 (0.16%) Databricks
8 1 (0.16%) PagerDuty
8 1 (0.16%) Red Hat
8 1 (0.16%) SAP