.NET Jobs with Work from Home Options

Microsoft .NET (dotNet)
UK > Work from Home

The table below provides summary statistics for permanent job vacancies with an option to work from home (WFH) and a requirement for .NET skills. Included is a benchmarking guide to the salaries offered in vacancies that have cited .NET over the 6 months to 6 December 2023 with a comparison to the same period in the previous 2 years.

6 months to
6 Dec 2023
Same period 2022 Same period 2021
Rank 25 17 16
Rank change year-on-year -8 -1 -5
Permanent jobs citing .NET 2,037 6,706 6,370
As % of all permanent jobs with a WFH option 8.99% 12.31% 12.67%
As % of the Libraries, Frameworks & Software Standards category 29.72% 32.83% 28.34%
Number of salaries quoted 1,755 4,727 5,278
10th Percentile £40,500 £39,250 £36,250
25th Percentile £47,500 £46,250 £42,500
Median annual salary (50th Percentile) £60,000 £60,000 £55,000
Median % change year-on-year - +9.09% +10.00%
75th Percentile £77,500 £77,500 £67,500
90th Percentile £90,000 £90,000 £81,250
UK median annual salary £65,000 £60,000 £55,000
% change year-on-year +8.33% +9.09% -

All Software Libraries and Frameworks
Work from Home

.NET is in the Software Libraries and Frameworks category. The following table is for comparison with the above and provides summary statistics for all permanent job vacancies with a WFH option and a requirement for technical specification, industry standards, software libraries and framework skills.

Permanent vacancies with a requirement for technical specification, industry standards, software libraries and framework skills 6,853 20,427 22,475
As % of all permanent jobs with a WFH option 30.24% 37.50% 44.71%
Number of salaries quoted 5,440 14,049 16,469
10th Percentile £41,750 £41,250 £36,250
25th Percentile £51,250 £50,000 £45,000
Median annual salary (50th Percentile) £65,000 £65,000 £60,000
Median % change year-on-year - +8.33% +9.09%
75th Percentile £85,000 £85,000 £77,500
90th Percentile £102,500 £98,750 £95,000
UK median annual salary £66,056 £65,000 £60,000
% change year-on-year +1.62% +8.33% +4.35%

.NET
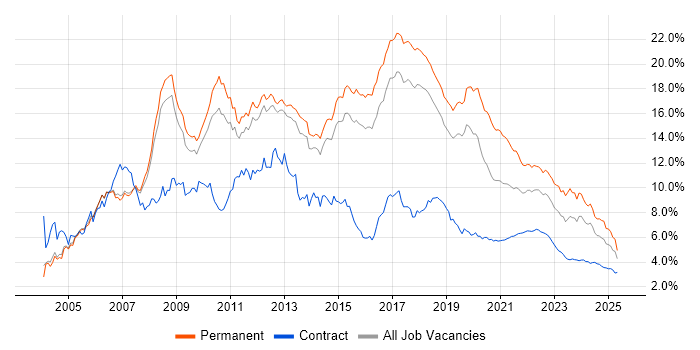
Trend for Jobs with a WFH Option

Job vacancies with a work from home option citing .NET as a proportion of all IT jobs advertised.

.NET trend for jobs with a WFH option

.NET
Salary Trend for Jobs with a WFH Option

3-month moving average salary quoted in job vacancies with a work from home option citing .NET.

.NET salary trend for jobs with a WFH option

.NET
Salary Histogram for Jobs with a WFH Option

Salary distribution for jobs with a work from home option citing .NET over the 6 months to 6 December 2023.

.NET salary histogram for jobs with a WFH option

.NET
Co-occurring Skills and Capabilities with WFH Options by Category

The follow tables expand on the table above by listing co-occurrences grouped by category. The same employment type, locality and period is covered with up to 20 co-occurrences shown in each of the following categories:

Application Platforms
1 56 (2.75%) IIS
1 56 (2.75%) SharePoint
2 49 (2.41%) Umbraco
3 47 (2.31%) CMS
4 32 (1.57%) Confluence
5 26 (1.28%) WebLogic
6 13 (0.64%) NServiceBus
6 13 (0.64%) WebSphere
6 13 (0.64%) WebSphere Application Server
7 11 (0.54%) nginx
8 10 (0.49%) Sitecore CMS
9 7 (0.34%) Kentico
10 6 (0.29%) Tomcat
11 5 (0.25%) Apache
11 5 (0.25%) Apache Airflow
12 4 (0.20%) Apache Spark
12 4 (0.20%) Oracle SOA Suite
12 4 (0.20%) WordPress
13 3 (0.15%) SharePoint 2010
13 3 (0.15%) SharePoint 2013
Applications
1 23 (1.13%) Microsoft Office
2 5 (0.25%) MS Visio
3 4 (0.20%) Microsoft Excel
4 2 (0.098%) Microsoft PowerPoint
5 1 (0.049%) Adobe Illustrator
5 1 (0.049%) Chatbot
5 1 (0.049%) Photoshop
Business Applications
1 117 (5.74%) Dynamics CRM
2 13 (0.64%) Payment Gateway
3 8 (0.39%) Shopify
4 6 (0.29%) BusinessWorks
4 6 (0.29%) Dynamics GP
4 6 (0.29%) Visualfiles
5 5 (0.25%) Unit4 Business World
6 4 (0.20%) Elite 3E
7 3 (0.15%) Dynamics NAV
7 3 (0.15%) Maximo
8 2 (0.098%) Salerio
8 2 (0.098%) SAP CX
8 2 (0.098%) SDL Web 8
9 1 (0.049%) Distributed Ledger
9 1 (0.049%) Dynamics AX
9 1 (0.049%) Salesforce CRM
9 1 (0.049%) SAP CRM
9 1 (0.049%) Sparx Enterprise Architect
Cloud Services
1 1,092 (53.61%) Azure
2 364 (17.87%) Azure DevOps
3 352 (17.28%) AWS
4 186 (9.13%) Power Platform
5 168 (8.25%) SaaS
6 156 (7.66%) Dynamics 365
7 112 (5.50%) GCP
8 101 (4.96%) Serverless
9 86 (4.22%) Azure Service Bus
10 58 (2.85%) Azure Logic Apps
11 54 (2.65%) GitHub
12 47 (2.31%) PowerApps
13 44 (2.16%) Microsoft 365
14 42 (2.06%) Azure Functions
15 41 (2.01%) PaaS
16 40 (1.96%) Azure Cosmos DB
17 21 (1.03%) AWS Lambda
17 21 (1.03%) IaaS
18 19 (0.93%) Cloud Computing
19 18 (0.88%) Azure API Management
Communications & Networking
1 16 (0.79%) HTTP
2 11 (0.54%) DNS
2 11 (0.54%) Internet
3 7 (0.34%) Firewall
4 6 (0.29%) SSL
4 6 (0.29%) TCP/IP
5 5 (0.25%) iSCSI
6 4 (0.20%) DHCP
6 4 (0.20%) LAN
6 4 (0.20%) Modbus
7 3 (0.15%) RTP
8 2 (0.098%) IPv6
8 2 (0.098%) WAN
8 2 (0.098%) Wi-Fi
8 2 (0.098%) Wireshark
9 1 (0.049%) BIG-IP
9 1 (0.049%) Bluetooth
9 1 (0.049%) Broadband
9 1 (0.049%) Network Security
9 1 (0.049%) VPN
Database & Business Intelligence
1 666 (32.70%) SQL Server
2 125 (6.14%) Power BI
3 82 (4.03%) Relational Database
4 80 (3.93%) NoSQL
5 63 (3.09%) PostgreSQL
6 56 (2.75%) Elasticsearch
7 50 (2.45%) SQL Server Integration Services
8 49 (2.41%) MySQL
9 47 (2.31%) MongoDB
10 46 (2.26%) Redis
11 43 (2.11%) Azure SQL Database
12 42 (2.06%) SQL Server Reporting Services
13 20 (0.98%) Data Warehouse
14 13 (0.64%) Big Data
14 13 (0.64%) BusinessObjects
14 13 (0.64%) BusinessObjects Business Intelligence
15 10 (0.49%) Data Lake
15 10 (0.49%) Event Store
15 10 (0.49%) RavenDB
16 8 (0.39%) Oracle Database
Development Applications
1 250 (12.27%) Git
2 107 (5.25%) JIRA
3 102 (5.01%) Visual Studio
4 45 (2.21%) GitLab
5 44 (2.16%) TeamCity
6 40 (1.96%) Postman
7 38 (1.87%) Jenkins
8 35 (1.72%) Octopus Deploy
9 34 (1.67%) Team Foundation Server
10 31 (1.52%) Selenium
11 27 (1.33%) Sonatype Nexus
12 23 (1.13%) NUnit
12 23 (1.13%) SpecFlow
13 15 (0.74%) Visual Studio Code
14 13 (0.64%) Oracle APEX
15 12 (0.59%) Visual Studio Team System
16 11 (0.54%) Mercurial
16 11 (0.54%) MSTest
16 11 (0.54%) SonarQube
17 9 (0.44%) Gatling
General
1 382 (18.75%) Finance
2 357 (17.53%) Social Skills
3 143 (7.02%) Analytical Skills
4 103 (5.06%) Inclusion and Diversity
5 89 (4.37%) Banking
6 84 (4.12%) Retail
7 51 (2.50%) Marketing
8 49 (2.41%) Public Sector
9 47 (2.31%) Legal
10 45 (2.21%) Law
11 27 (1.33%) Tech for Good
12 23 (1.13%) Games
13 21 (1.03%) Organisational Skills
14 20 (0.98%) Health Technology
15 17 (0.83%) Back Office
16 15 (0.74%) Advertising
16 15 (0.74%) Presentation Skills
17 14 (0.69%) Automotive
17 14 (0.69%) Influencing Skills
17 14 (0.69%) Manufacturing
Job Titles
1 1,249 (61.32%) Developer
2 583 (28.62%) .NET Developer
3 419 (20.57%) Senior
4 334 (16.40%) C# Developer
5 277 (13.60%) Software Engineer
6 259 (12.71%) Senior Developer
7 256 (12.57%) Software Developer
8 250 (12.27%) Lead
9 215 (10.55%) Full Stack Developer
10 213 (10.46%) C# .NET Developer
11 129 (6.33%) Lead Developer
12 128 (6.28%) Senior .NET Developer
13 104 (5.11%) Architect
13 104 (5.11%) Senior Software Engineer
14 83 (4.07%) Full Stack .NET Developer
15 78 (3.83%) Dynamics 365 Developer
16 76 (3.73%) CRM Developer
17 74 (3.63%) Analyst
18 70 (3.44%) C# Software Developer
19 65 (3.19%) Dynamics CRM Developer
Libraries, Frameworks & Software Standards
1 593 (29.11%) .NET Core
2 502 (24.64%) HTML
3 500 (24.55%) CSS
4 499 (24.50%) ASP.NET
5 439 (21.55%) .NET Framework
6 413 (20.27%) AngularJS
7 367 (18.02%) React
8 232 (11.39%) ASP.NET Web API
9 179 (8.79%) REST
10 177 (8.69%) ASP.NET MVC
11 165 (8.10%) Entity Framework
12 150 (7.36%) Web Services
13 142 (6.97%) jQuery
14 114 (5.60%) Blazor
15 105 (5.15%) RESTful
16 94 (4.61%) HTML5
17 82 (4.03%) Node.js
18 80 (3.93%) XML
19 77 (3.78%) Vue
20 75 (3.68%) JSON
Miscellaneous
1 112 (5.50%) Greenfield Project
2 91 (4.47%) Product Ownership
3 66 (3.24%) Mobile App
4 64 (3.14%) Self-Motivation
5 44 (2.16%) Cloud Native
6 37 (1.82%) Enterprise Software
7 35 (1.72%) Legacy Systems
8 32 (1.57%) Virtual Team
9 31 (1.52%) Cyberattack
9 31 (1.52%) Legacy Applications
10 25 (1.23%) Linux Command Line
11 23 (1.13%) Distributed Systems
12 22 (1.08%) Foreign Exchange (FX)
13 17 (0.83%) IoT
14 15 (0.74%) Low-Code
15 12 (0.59%) Public Cloud
16 11 (0.54%) Blog
16 11 (0.54%) Onboarding
16 11 (0.54%) Sports Betting
17 9 (0.44%) Data Structures
Operating Systems
1 143 (7.02%) Windows
2 66 (3.24%) Linux
3 54 (2.65%) Unix
4 50 (2.45%) Android
5 30 (1.47%) Windows Server
6 20 (0.98%) Apple iOS
7 11 (0.54%) VMS
8 6 (0.29%) Red Hat Enterprise Linux
9 3 (0.15%) Windows 10
10 2 (0.098%) Windows Server 2016
11 1 (0.049%) Mac OS
11 1 (0.049%) SUSE
11 1 (0.049%) Windows Server 2008
11 1 (0.049%) Windows Server 2012
Processes & Methodologies
1 891 (43.74%) Agile
2 627 (30.78%) DevOps
3 545 (26.76%) Software Engineering
4 471 (23.12%) Full Stack Development
5 428 (21.01%) MVC
6 416 (20.42%) CI/CD
7 339 (16.64%) Problem-Solving
8 294 (14.43%) Microservices
9 269 (13.21%) TDD
10 245 (12.03%) Scrum
11 237 (11.63%) Mentoring
12 228 (11.19%) SDLC
13 178 (8.74%) Unit Testing
14 173 (8.49%) Design Patterns
15 160 (7.85%) Web Development
16 159 (7.81%) Test Automation
17 147 (7.22%) CRM
18 136 (6.68%) Business Intelligence
19 133 (6.53%) Containerisation
20 127 (6.23%) SOLID
Programming Languages
1 1,637 (80.36%) C#
2 838 (41.14%) SQL
3 830 (40.75%) JavaScript
4 216 (10.60%) TypeScript
5 200 (9.82%) Java
6 163 (8.00%) T-SQL
7 157 (7.71%) Python
8 137 (6.73%) PowerShell
9 85 (4.17%) VB.NET
10 52 (2.55%) C++
11 38 (1.87%) Go
12 30 (1.47%) Rust
13 28 (1.37%) Bash
13 28 (1.37%) PL/SQL
14 18 (0.88%) Ruby
15 17 (0.83%) PHP
16 16 (0.79%) Bicep
16 16 (0.79%) C
17 14 (0.69%) VB
18 13 (0.64%) Delphi
Qualifications
1 166 (8.15%) Degree
2 153 (7.51%) Security Cleared
3 105 (5.15%) SC Cleared
4 40 (1.96%) DV Cleared
5 34 (1.67%) Microsoft Certification
6 27 (1.33%) Computer Science Degree
7 26 (1.28%) AWS Certification
8 23 (1.13%) AWS Certified Cloud Practitioner
8 23 (1.13%) AWS Certified Developer
8 23 (1.13%) AWS Certified Solutions Architect
9 21 (1.03%) BPSS Clearance
10 18 (0.88%) Azure Certification
11 13 (0.64%) ITIL Certification
12 6 (0.29%) ITIL Foundation Certificate
13 4 (0.20%) DBS Check
14 3 (0.15%) CTC Cleared
14 3 (0.15%) ISTQB
14 3 (0.15%) Master's Degree
14 3 (0.15%) MCPD
14 3 (0.15%) PMI Certification
Quality Assurance & Compliance
1 150 (7.36%) QA
2 31 (1.52%) Accessibility
2 31 (1.52%) SLA
3 10 (0.49%) WCAG
4 7 (0.34%) PCI DSS
5 6 (0.29%) NCSC
6 5 (0.25%) ISO/IEC 27001
7 4 (0.20%) GDPR
8 3 (0.15%) Data Quality
8 3 (0.15%) ISO/IEC 20000
9 1 (0.049%) California Consumer Privacy Act
9 1 (0.049%) GLBA
9 1 (0.049%) HL7
9 1 (0.049%) ISO 31000
9 1 (0.049%) ISO/IEC 27002 (supersedes ISO/IEC 17799)
9 1 (0.049%) ISO/IEC 27005
9 1 (0.049%) NIST
9 1 (0.049%) NIST 800
9 1 (0.049%) PMO
System Software
1 199 (9.77%) Docker
2 28 (1.37%) Active Directory
3 11 (0.54%) Virtual Machines
4 2 (0.098%) VMware Infrastructure
5 1 (0.049%) vSphere
Systems Management
1 145 (7.12%) Kubernetes
2 66 (3.24%) Terraform
3 27 (1.33%) Single Sign-On
4 26 (1.28%) AirWatch
4 26 (1.28%) OpenSSO
5 13 (0.64%) Ansible
6 7 (0.34%) Grafana
7 5 (0.25%) Microsoft Clustering
8 4 (0.20%) Istio
9 3 (0.15%) MIIS
9 3 (0.15%) Progress Chef
10 2 (0.098%) Control-M
10 2 (0.098%) Nagios
10 2 (0.098%) Oracle Identity Management
10 2 (0.098%) Packer
11 1 (0.049%) Docker Swarm
11 1 (0.049%) FlexNet
11 1 (0.049%) logstash
11 1 (0.049%) Microsoft Intune
11 1 (0.049%) Prometheus
Vendors
1 615 (30.19%) Microsoft
2 90 (4.42%) Oracle
3 50 (2.45%) Salesforce
4 44 (2.16%) Xamarin
5 34 (1.67%) Google
6 23 (1.13%) Sitecore
7 18 (0.88%) ServiceNow
8 14 (0.69%) Zoho
9 12 (0.59%) Databricks
9 12 (0.59%) SAP
10 8 (0.39%) iManage
11 7 (0.34%) TIBCO
12 6 (0.29%) OpenAI
13 5 (0.25%) MuleSoft
13 5 (0.25%) Splunk
13 5 (0.25%) Unisys
14 4 (0.20%) IBM
14 4 (0.20%) RedGate
14 4 (0.20%) TOWER Software
14 4 (0.20%) VMware