Software Engineering Jobs with Hybrid/Remote/WFH Options

Software Engineering
UK > Work from Home

The table below provides summary statistics for permanent remote or hybrid work requiring Software Engineering skills. It includes a benchmarking guide to the annual salaries offered in vacancies that cited Software Engineering over the 6 months leading up to 1 May 2025, comparing them to the same period in the previous two years.

6 months to
1 May 2025
Same period 2024 Same period 2023
Rank 14 12 12
Rank change year-on-year -2 0 -2
Permanent jobs citing Software Engineering 1,824 4,090 5,855
As % of all permanent jobs with a WFH option 12.20% 12.09% 13.69%
As % of the Processes & Methodologies category 13.09% 13.19% 14.25%
Number of salaries quoted 1,484 3,211 4,030
10th Percentile £45,000 £41,250 £45,000
25th Percentile £56,250 £50,000 £55,000
Median annual salary (50th Percentile) £74,870 £65,000 £70,000
Median % change year-on-year +15.18% -7.14% +3.70%
75th Percentile £108,750 £86,250 £93,438
90th Percentile £137,500 £112,500 £116,250
UK median annual salary £66,206 £62,500 £70,000
% change year-on-year +5.93% -10.71% -

All Process and Methodology Skills
Work from Home

Software Engineering falls under the Processes and Methodologies category. For comparison with the information above, the following table provides summary statistics for all permanent job vacancies with remote or hybrid options requiring process or methodology skills.

Permanent vacancies with a requirement for process or methodology skills 13,930 31,014 41,082
As % of all permanent jobs with a WFH option 93.15% 91.65% 96.09%
Number of salaries quoted 9,709 23,583 28,561
10th Percentile £30,000 £33,930 £37,500
25th Percentile £45,000 £42,500 £47,500
Median annual salary (50th Percentile) £60,000 £57,500 £62,500
Median % change year-on-year +4.35% -8.00% +4.17%
75th Percentile £77,500 £75,000 £82,500
90th Percentile £102,500 £95,000 £100,000
UK median annual salary £57,500 £55,000 £61,500
% change year-on-year +4.55% -10.57% +2.50%

Software Engineering
Trend for Jobs with a WFH Option

Job vacancies with remote working options citing Software Engineering as a proportion of all IT jobs advertised.
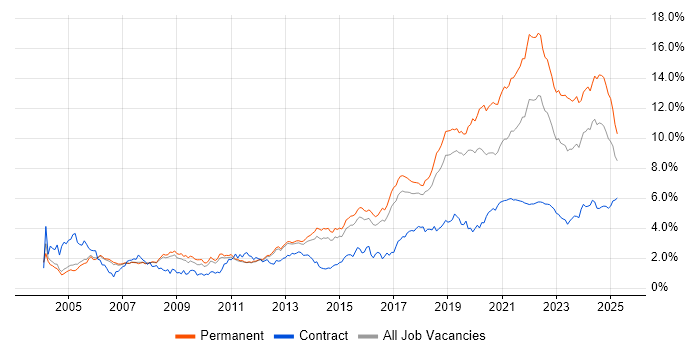
Software Engineering trend for jobs with Hybrid/Remote/WFH options

Software Engineering
Salary Trend for Jobs with a WFH Option

3-month moving average salary quoted in job vacancies with remote working options citing Software Engineering.

Software Engineering salary trend for jobs with a WFH option

Software Engineering
Salary Histogram for Jobs with a WFH Option

Salary distribution for jobs with remote working options citing Software Engineering over the 6 months to 1 May 2025.

Software Engineering salary histogram for jobs with a WFH option

Software Engineering
Co-occurring Skills and Capabilities with WFH Options by Category

The follow tables expand on the table above by listing co-occurrences grouped by category. The same employment type, locality and period is covered with up to 20 co-occurrences shown in each of the following categories:

Application Platforms
1 239 (13.10%) Apache Airflow
2 193 (10.58%) Apache
3 97 (5.32%) Apache Spark
4 35 (1.92%) Confluence
5 23 (1.26%) Jupyter
6 15 (0.82%) SharePoint
7 11 (0.60%) CMS
8 6 (0.33%) Headless CMS
9 5 (0.27%) Microsoft Exchange
10 4 (0.22%) IIS
11 3 (0.16%) Adobe Experience Manager
11 3 (0.16%) CICS
12 2 (0.11%) Kinematics
12 2 (0.11%) Solana
12 2 (0.11%) WebSphere
13 1 (0.055%) Ethereum
13 1 (0.055%) Mendix
13 1 (0.055%) Mule
13 1 (0.055%) nginx
13 1 (0.055%) Strapi
Applications
1 52 (2.85%) Chatbot
2 4 (0.22%) Microsoft Excel
3 3 (0.16%) Microsoft Office
3 3 (0.16%) Trello
4 2 (0.11%) Microsoft Project
4 2 (0.11%) Simulink
5 1 (0.055%) Adobe Creative Suite
5 1 (0.055%) Adobe XD
5 1 (0.055%) Microsoft PowerPoint
5 1 (0.055%) Sketch
Business Applications
1 14 (0.77%) Dynamics CRM
2 9 (0.49%) Shopify
3 5 (0.27%) Magento
3 5 (0.27%) NetSuite
4 3 (0.16%) Q-Pulse
5 2 (0.11%) Oracle BPM
5 2 (0.11%) Oracle Subledger Accounting
6 1 (0.055%) BASE24
6 1 (0.055%) Endur
6 1 (0.055%) Oracle ERP
6 1 (0.055%) Salesforce CRM
6 1 (0.055%) SAP ERP
Cloud Services
1 767 (42.05%) AWS
2 465 (25.49%) Azure
3 367 (20.12%) GCP
4 234 (12.83%) dbt
5 190 (10.42%) Serverless
6 167 (9.16%) AWS Lambda
7 150 (8.22%) Amazon ECS
8 112 (6.14%) GitHub
9 110 (6.03%) Amazon EKS
10 100 (5.48%) SaaS
11 98 (5.37%) Amazon EC2
11 98 (5.37%) AWS CloudFormation
12 96 (5.26%) Snowflake
13 94 (5.15%) Azure DevOps
14 83 (4.55%) OpenShift
15 80 (4.39%) Amazon S3
16 60 (3.29%) Power Platform
17 45 (2.47%) GitHub Actions
18 39 (2.14%) Dagster
19 33 (1.81%) Amazon SQS
Communications & Networking
1 26 (1.43%) Wireless
2 23 (1.26%) HTTP
3 22 (1.21%) Bluetooth
4 14 (0.77%) Network Security
5 11 (0.60%) Modbus
6 10 (0.55%) RS-232
6 10 (0.55%) WAN
6 10 (0.55%) Wi-Fi
7 9 (0.49%) ZigBee
8 8 (0.44%) 5G
8 8 (0.44%) SD-WAN
8 8 (0.44%) TCP/IP
9 7 (0.38%) Profibus
9 7 (0.38%) RS-485
10 6 (0.33%) Internet
11 5 (0.27%) BGP
11 5 (0.27%) Ethernet
11 5 (0.27%) IPsec
11 5 (0.27%) MPLS
11 5 (0.27%) OSPF
Database & Business Intelligence
1 240 (13.16%) Amazon Athena
2 226 (12.39%) Apache Iceberg
2 226 (12.39%) Dremio
3 219 (12.01%) Apache Arrow
4 170 (9.32%) Apache Ignite
5 141 (7.73%) PostgreSQL
6 85 (4.66%) Data Lake
7 83 (4.55%) SQL Server
8 77 (4.22%) NoSQL
9 68 (3.73%) Elasticsearch
10 65 (3.56%) MySQL
11 52 (2.85%) MongoDB
12 42 (2.30%) Relational Database
13 33 (1.81%) Amazon RDS
13 33 (1.81%) Amazon Redshift
13 33 (1.81%) Big Data
14 19 (1.04%) Azure SQL Database
15 18 (0.99%) Power BI
16 15 (0.82%) Redis
17 13 (0.71%) BigQuery
Development Applications
1 207 (11.35%) Git
2 96 (5.26%) Jenkins
3 73 (4.00%) Artifactory
4 62 (3.40%) JIRA
5 55 (3.02%) GitLab
6 43 (2.36%) SonarQube
7 37 (2.03%) Visual Studio
8 36 (1.97%) Maven
9 29 (1.59%) JUnit
10 23 (1.26%) Cucumber
10 23 (1.26%) webpack
11 19 (1.04%) Sonatype Nexus
12 16 (0.88%) Gradle
13 14 (0.77%) IntelliJ
13 14 (0.77%) Mockito
14 11 (0.60%) Cypress.io
14 11 (0.60%) Moq
15 10 (0.55%) SpecFlow
16 9 (0.49%) Oracle Forms
17 8 (0.44%) Selenium
General
1 726 (39.80%) Finance
2 416 (22.81%) Banking
3 314 (17.21%) Front Office
4 307 (16.83%) Social Skills
5 157 (8.61%) Inclusion and Diversity
6 132 (7.24%) Analytical Skills
7 114 (6.25%) Games
8 89 (4.88%) Investment Banking
9 64 (3.51%) Retail
10 52 (2.85%) Electronics
11 48 (2.63%) Law
12 44 (2.41%) Manufacturing
13 43 (2.36%) Public Sector
14 41 (2.25%) Tech for Good
15 35 (1.92%) Legal
16 34 (1.86%) Advertising
17 26 (1.43%) Automotive
17 26 (1.43%) Marketing
18 23 (1.26%) Influencing Skills
19 21 (1.15%) Pharmaceutical
Job Titles
1 928 (50.88%) Software Engineer
2 564 (30.92%) Senior
3 372 (20.39%) Developer
4 341 (18.70%) Senior Software Engineer
5 265 (14.53%) AWS Engineer
6 222 (12.17%) Python Engineer
7 195 (10.69%) Lead
8 160 (8.77%) AWS Software Engineer
9 144 (7.89%) Java Engineer
10 142 (7.79%) Java Software Engineer
11 131 (7.18%) Developer/Software Engineer
12 120 (6.58%) Python Software Engineer
13 114 (6.25%) DevOps Engineer
14 113 (6.20%) AWS DevOps
15 107 (5.87%) Software Developer
16 99 (5.43%) AWS DevOps Engineer
16 99 (5.43%) Data Engineer
17 93 (5.10%) Senior Developer
18 92 (5.04%) AWS Developer
19 76 (4.17%) Architect
Libraries, Frameworks & Software Standards
1 399 (21.88%) React
2 331 (18.15%) .NET
3 279 (15.30%) Node.js
4 192 (10.53%) AngularJS
5 189 (10.36%) Pandas
6 181 (9.92%) Kafka
7 146 (8.00%) NumPy
8 137 (7.51%) HTML
8 137 (7.51%) SciPy
9 129 (7.07%) PySpark
9 129 (7.07%) Spring
10 106 (5.81%) Vue
11 102 (5.59%) CSS
12 101 (5.54%) gRPC
12 101 (5.54%) Spring Boot
13 100 (5.48%) Protocol Buffers
13 100 (5.48%) Redux
14 95 (5.21%) .NET Core
15 89 (4.88%) RESTful
16 76 (4.17%) J2EE
Miscellaneous
1 201 (11.02%) Fixed Income
2 138 (7.57%) Algorithms
3 133 (7.29%) Foreign Exchange (FX)
4 126 (6.91%) Equities
5 105 (5.76%) Hedge funds
6 99 (5.43%) Derivative
7 90 (4.93%) Distributed Systems
8 88 (4.82%) Product Ownership
9 80 (4.39%) Cloud Native
10 77 (4.22%) Mobile App
11 72 (3.95%) Cyberattack
12 69 (3.78%) Management Information System
13 51 (2.80%) Greenfield Project
14 44 (2.41%) Public Cloud
15 40 (2.19%) Embedded Systems
16 39 (2.14%) Pricing Data
17 32 (1.75%) Data Structures
18 30 (1.64%) IoT
19 27 (1.48%) Private Cloud
20 26 (1.43%) Virtual Team
Operating Systems
1 175 (9.59%) Linux
2 84 (4.61%) Android
3 40 (2.19%) Apple iOS
4 32 (1.75%) Windows
5 30 (1.64%) Unix
6 12 (0.66%) FreeRTOS
7 11 (0.60%) Robot Operating System
8 9 (0.49%) Embedded Linux
8 9 (0.49%) zOS
9 6 (0.33%) Ubuntu
10 5 (0.27%) Windows Server
11 2 (0.11%) Debian
11 2 (0.11%) Mac OS
11 2 (0.11%) VMS
12 1 (0.055%) CentOS
12 1 (0.055%) ThreadX
Processes & Methodologies
1 951 (52.14%) Agile
2 546 (29.93%) DevOps
3 487 (26.70%) CI/CD
4 361 (19.79%) Mentoring
5 324 (17.76%) Microservices
6 301 (16.50%) Asset Management
7 273 (14.97%) Fintech
8 258 (14.14%) Problem-Solving
9 256 (14.04%) Artificial Intelligence
10 247 (13.54%) Computer Science
11 219 (12.01%) TDD
12 199 (10.91%) Full-Stack Development
13 196 (10.75%) Containerisation
14 189 (10.36%) Mathematics
15 178 (9.76%) Test Automation
16 170 (9.32%) Line Management
17 162 (8.88%) SDLC
18 153 (8.39%) Investment Management
18 153 (8.39%) Roadmaps
19 145 (7.95%) Technical Leadership
Programming Languages
1 750 (41.12%) Python
2 662 (36.29%) JavaScript
3 632 (34.65%) Java
4 421 (23.08%) TypeScript
5 377 (20.67%) C#
6 324 (17.76%) SQL
7 232 (12.72%) C++
8 200 (10.96%) Go
9 123 (6.74%) C
10 79 (4.33%) PHP
11 76 (4.17%) Rust
12 42 (2.30%) Kotlin
13 37 (2.03%) Scala
14 35 (1.92%) Bash
15 34 (1.86%) Ruby
16 21 (1.15%) PowerShell
17 20 (1.10%) Swift
18 19 (1.04%) Embedded C
19 14 (0.77%) Shell Script
20 13 (0.71%) Perl
Qualifications
1 421 (23.08%) Degree
2 179 (9.81%) Security Cleared
3 137 (7.51%) Computer Science Degree
4 87 (4.77%) DV Cleared
5 80 (4.39%) SC Cleared
6 77 (4.22%) Master's Degree
7 43 (2.36%) PhD
8 27 (1.48%) AWS Certification
9 23 (1.26%) AWS Certified Solutions Architect
10 16 (0.88%) Numerate Degree
11 14 (0.77%) Azure Certification
12 13 (0.71%) DBS Check
13 11 (0.60%) BPSS Clearance
14 3 (0.16%) HNC
14 3 (0.16%) ISTQB
14 3 (0.16%) Microsoft Certification
14 3 (0.16%) TOGAF Certification
15 2 (0.11%) CCA
15 2 (0.11%) ITIL Certification
16 1 (0.055%) MCSD
Quality Assurance & Compliance
1 119 (6.52%) QA
2 53 (2.91%) Accessibility
3 17 (0.93%) GDPR
4 13 (0.71%) Data Quality
4 13 (0.71%) HIPAA
5 10 (0.55%) ISO/IEC 27001
6 8 (0.44%) NCSC
6 8 (0.44%) PMO
7 6 (0.33%) CDISC
7 6 (0.33%) IEC 61131
7 6 (0.33%) NIST
7 6 (0.33%) Sarbanes-Oxley
8 5 (0.27%) SLA
9 4 (0.22%) ISO 9001
9 4 (0.22%) JSP 440
9 4 (0.22%) NIST 800
9 4 (0.22%) PCI DSS
9 4 (0.22%) SOC 2
10 3 (0.16%) IEC 62304
10 3 (0.16%) JTAG
System Software
1 393 (21.55%) Docker
2 21 (1.15%) Firmware
3 12 (0.66%) Embedded Firmware
4 6 (0.33%) VMware Infrastructure
5 4 (0.22%) Virtual Machines
6 3 (0.16%) Active Directory
7 2 (0.11%) VMware ESXi
Systems Management
1 433 (23.74%) Kubernetes
2 264 (14.47%) Terraform
3 82 (4.50%) Ansible
4 26 (1.43%) Prometheus
5 21 (1.15%) Grafana
6 13 (0.71%) Istio
7 7 (0.38%) Argo
7 7 (0.38%) CA Endevor
8 6 (0.33%) Kustomize
9 3 (0.16%) Progress Chef
9 3 (0.16%) Puppet
10 2 (0.11%) MAINVIEW
10 2 (0.11%) Packer
10 2 (0.11%) vCenter Server
11 1 (0.055%) CA Service Virtualization
11 1 (0.055%) CloudHub
11 1 (0.055%) Kibana
11 1 (0.055%) Microsoft Intune
Vendors
1 161 (8.83%) Microsoft
2 113 (6.20%) Google
3 46 (2.52%) IBM
4 36 (1.97%) PayPal
5 29 (1.59%) Oracle
6 25 (1.37%) Apple
7 21 (1.15%) Databricks
8 16 (0.88%) New Relic
8 16 (0.88%) Salesforce
9 10 (0.55%) Siemens
10 9 (0.49%) Adobe
11 8 (0.44%) Telerik
12 7 (0.38%) Cisco
13 6 (0.33%) Sawtooth Software
13 6 (0.33%) VMware
14 5 (0.27%) Atlassian
14 5 (0.27%) Intel
14 5 (0.27%) ServiceNow
14 5 (0.27%) Xilinx
15 4 (0.22%) SAP