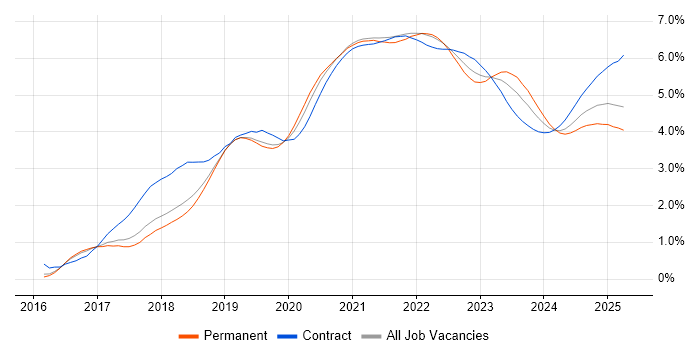
Hybrid/Remote Terraform Job Trends

Terraform
UK > Work from Home

The table below provides summary statistics and salary benchmarking for remote or hybrid work requiring Terraform skills. It covers vacancies from the 6 months leading up to 18 September 2025, with comparisons to the same periods in the previous two years.

6 months to
18 Sep 2025
Same period 2024 Same period 2023
Rank 66 62 47
Rank change year-on-year -4 -15 -1
Permanent jobs citing Terraform 785 990 1,492
As % of all permanent jobs with a WFH option 4.82% 4.22% 6.08%
As % of the Systems Management category 42.20% 37.67% 38.05%
Number of salaries quoted 364 674 1,318
10th Percentile £49,125 £47,875 £52,500
25th Percentile £58,750 £60,013 £58,750
Median annual salary (50th Percentile) £75,000 £75,000 £75,000
75th Percentile £85,313 £93,750 £90,000
90th Percentile £97,500 £112,500 £106,250
UK median annual salary £75,000 £75,000 £75,000

All Systems Management Skills
Work from Home

Terraform falls under the Systems Management category. For comparison with the information above, the following table provides summary statistics for all permanent job vacancies with remote or hybrid options requiring systems management skills.

Permanent vacancies with a requirement for systems management skills 1,860 2,628 3,921
As % of all permanent jobs with a WFH option 11.41% 11.21% 15.97%
Number of salaries quoted 1,022 1,612 3,398
10th Percentile £35,000 £38,025 £42,382
25th Percentile £47,125 £48,750 £52,500
Median annual salary (50th Percentile) £65,000 £66,500 £69,447
Median % change year-on-year -2.26% -4.24% -0.79%
75th Percentile £82,500 £85,000 £85,000
90th Percentile £97,375 £105,000 £100,000
UK median annual salary £62,500 £65,000 £65,000
% change year-on-year -3.85% - -3.70%

Terraform
Trend for Jobs with a WFH Option

Job vacancies with remote working options citing Terraform as a proportion of all IT jobs advertised.

Terraform trend for jobs with Hybrid/Remote/WFH options

Terraform
Salary Trend for Jobs with Hybrid Work Options

Salary distribution trend for jobs with remote work options citing Terraform.

Salary distribution trend for jobs with remote work options citing Terraform

Terraform
Salary Histogram for Jobs with a WFH Option

Salary distribution for jobs with remote working options citing Terraform over the 6 months to 18 September 2025.

Terraform salary histogram for jobs with a WFH option

Terraform
Co-occurring Skills and Capabilities with WFH Options by Category

The follow tables expand on the table above by listing co-occurrences grouped by category. The same employment type, locality and period is covered with up to 20 co-occurrences shown in each of the following categories:

Application Platforms
1 17 (2.17%) Microsoft Exchange
2 16 (2.04%) IIS
3 13 (1.66%) SharePoint
4 11 (1.40%) Apache
5 10 (1.27%) Apache Spark
6 9 (1.15%) Apache Airflow
7 7 (0.89%) Oracle SOA Suite
8 4 (0.51%) nginx
9 3 (0.38%) Confluence
10 2 (0.25%) BizTalk Server
11 1 (0.13%) Apache Solr
11 1 (0.13%) ArcGIS
11 1 (0.13%) Drupal
11 1 (0.13%) Tomcat
Applications
1 4 (0.51%) Spreadsheet
2 1 (0.13%) Microsoft Office
Business Applications
1 15 (1.91%) Oracle ERP
2 1 (0.13%) Dynamics CRM
Cloud Services
1 324 (41.27%) Azure
2 323 (41.15%) AWS
3 114 (14.52%) AWS CloudFormation
4 109 (13.89%) Azure DevOps
5 89 (11.34%) GitHub
6 84 (10.70%) Amazon EKS
7 83 (10.57%) GCP
8 65 (8.28%) Serverless
9 55 (7.01%) AWS Lambda
9 55 (7.01%) GitHub Actions
10 46 (5.86%) SaaS
11 42 (5.35%) Entra ID
12 37 (4.71%) Microsoft 365
13 36 (4.59%) Azure Monitor
14 33 (4.20%) Amazon CloudWatch
15 32 (4.08%) Amazon S3
16 27 (3.44%) Amazon EC2
16 27 (3.44%) PaaS
17 26 (3.31%) OCI
18 25 (3.18%) Snowflake
Communications & Networking
1 298 (37.96%) VPN
2 264 (33.63%) Cisco IOS
3 56 (7.13%) Firewall
4 43 (5.48%) WAN
5 32 (4.08%) LAN
6 26 (3.31%) DNS
7 19 (2.42%) Network Security
8 15 (1.91%) SD-WAN
9 13 (1.66%) TCP/IP
10 8 (1.02%) DHCP
11 7 (0.89%) SSL
12 6 (0.76%) Fibre Channel
12 6 (0.76%) Wi-Fi
12 6 (0.76%) Wireless
13 5 (0.64%) BGP
13 5 (0.64%) Broadband
14 4 (0.51%) IPsec
14 4 (0.51%) OSPF
14 4 (0.51%) SAN
15 3 (0.38%) SSH
Database & Business Intelligence
1 64 (8.15%) Elasticsearch
2 26 (3.31%) SQL Server
3 25 (3.18%) Amazon RDS
4 21 (2.68%) Data Warehouse
5 20 (2.55%) NoSQL
6 18 (2.29%) MySQL
7 16 (2.04%) DynamoDB
7 16 (2.04%) Power BI
8 12 (1.53%) PostgreSQL
9 11 (1.40%) Big Data
10 10 (1.27%) Amazon Redshift
10 10 (1.27%) Data Lake
10 10 (1.27%) Tableau
11 9 (1.15%) Amazon Athena
12 6 (0.76%) Relational Database
13 5 (0.64%) Redis
14 4 (0.51%) BigQuery
14 4 (0.51%) MongoDB
15 3 (0.38%) Pinecone
16 2 (0.25%) Azure SQL Database
Development Applications
1 74 (9.43%) Jenkins
2 61 (7.77%) Git
3 40 (5.10%) GitLab
4 20 (2.55%) Sonatype Nexus
5 18 (2.29%) SonarQube
6 15 (1.91%) JIRA
6 15 (1.91%) Oracle Forms
7 14 (1.78%) JUnit
7 14 (1.78%) Maven
7 14 (1.78%) TeamCity
8 9 (1.15%) NUnit
9 8 (1.02%) Jasmine
10 7 (0.89%) Artifactory
11 6 (0.76%) IntelliJ
12 5 (0.64%) Cucumber
12 5 (0.64%) Mockito
13 3 (0.38%) Visual Studio Code
14 2 (0.25%) Bitbucket
14 2 (0.25%) Robot Framework
14 2 (0.25%) SQL Server Management Studio (SSMS)
General
1 331 (42.17%) Inclusion and Diversity
2 323 (41.15%) Analytical Skills
3 112 (14.27%) Finance
4 89 (11.34%) Social Skills
5 24 (3.06%) Banking
6 20 (2.55%) Public Sector
7 10 (1.27%) Law
8 9 (1.15%) Telecoms
9 8 (1.02%) Games
10 5 (0.64%) Advertising
10 5 (0.64%) Documentation Skills
10 5 (0.64%) Marketing
11 4 (0.51%) Retail
12 3 (0.38%) Health Technology
12 3 (0.38%) Presentation Skills
13 2 (0.25%) Automotive
13 2 (0.25%) Electronics
13 2 (0.25%) Manufacturing
14 1 (0.13%) Back Office
14 1 (0.13%) Tech for Good
Job Titles
1 293 (37.32%) Infrastructure Engineer
2 164 (20.89%) Senior
3 105 (13.38%) DevOps Engineer
4 97 (12.36%) Developer
5 94 (11.97%) Cloud Engineer
6 56 (7.13%) Lead
7 55 (7.01%) Azure Engineer
7 55 (7.01%) Software Developer
8 44 (5.61%) AWS Engineer
9 37 (4.71%) Senior Cloud Engineer
10 36 (4.59%) Data Engineer
11 34 (4.33%) Senior DevOps
12 32 (4.08%) Senior Developer
13 31 (3.95%) AWS DevOps
14 27 (3.44%) Senior DevOps Engineer
15 26 (3.31%) AWS DevOps Engineer
16 25 (3.18%) Platform Engineer
16 25 (3.18%) Software Engineer
17 23 (2.93%) Architect
18 21 (2.68%) Python Engineer
Libraries, Frameworks & Software Standards
1 277 (35.29%) Elastic Stack
2 103 (13.12%) .NET
3 68 (8.66%) Node.js
4 51 (6.50%) Pandas
5 38 (4.84%) RESTful
6 29 (3.69%) REST
7 27 (3.44%) React
8 22 (2.80%) Spring
8 22 (2.80%) Spring Boot
9 18 (2.29%) .NET Core
10 16 (2.04%) ARM Templates
11 15 (1.91%) AngularJS
12 14 (1.78%) Vue
13 13 (1.66%) JSON
14 12 (1.53%) ASP.NET
14 12 (1.53%) Kafka
15 11 (1.40%) AWS CDK
15 11 (1.40%) OAuth
15 11 (1.40%) PySpark
16 10 (1.27%) ASP.NET Core
Miscellaneous
1 313 (39.87%) Cyberattack
2 74 (9.43%) Cloud Native
3 32 (4.08%) Hybrid Cloud
4 29 (3.69%) Enterprise Software
5 26 (3.31%) Management Information System
6 25 (3.18%) Product Ownership
7 22 (2.80%) Onboarding
8 19 (2.42%) Public Cloud
9 18 (2.29%) Data Centre
10 17 (2.17%) Security Posture
11 10 (1.27%) Self-Motivation
12 9 (1.15%) Distributed Systems
13 7 (0.89%) Enterprise Cloud
14 6 (0.76%) Online Games
15 5 (0.64%) Credit Derivative
15 5 (0.64%) Operational Technology
15 5 (0.64%) SCADA
16 4 (0.51%) CMDB
16 4 (0.51%) Data Protection Act
16 4 (0.51%) Private Cloud
Operating Systems
1 416 (52.99%) Linux
2 319 (40.64%) Windows
3 311 (39.62%) Android
4 23 (2.93%) Unix
5 17 (2.17%) Windows Server
6 14 (1.78%) Red Hat Enterprise Linux
7 8 (1.02%) VMS
8 6 (0.76%) Debian
9 4 (0.51%) CentOS
10 3 (0.38%) Ubuntu
11 2 (0.25%) Windows Server 2019
12 1 (0.13%) Amazon Linux
12 1 (0.13%) Windows Server 2012
12 1 (0.13%) Windows Server 2016
Processes & Methodologies
1 580 (73.89%) DevOps
2 362 (46.11%) Problem-Solving
3 322 (41.02%) Infrastructure Engineering
3 322 (41.02%) Line Management
4 314 (40.00%) CI/CD
4 314 (40.00%) Mathematics
5 311 (39.62%) Platform Engineering
6 277 (35.29%) Infrastructure as Code
7 275 (35.03%) Task Automation
8 269 (34.27%) Risk Management
8 269 (34.27%) Storage Management
9 157 (20.00%) Agile
10 147 (18.73%) Containerisation
11 116 (14.78%) Software Engineering
12 77 (9.81%) Mentoring
13 64 (8.15%) Observability
14 63 (8.03%) Analytics
15 61 (7.77%) OO
16 58 (7.39%) Roadmaps
17 57 (7.26%) Coaching
Programming Languages
1 563 (71.72%) Python
2 356 (45.35%) PowerShell
3 340 (43.31%) Bash
4 103 (13.12%) SQL
5 100 (12.74%) Java
6 97 (12.36%) JavaScript
7 83 (10.57%) Go
8 54 (6.88%) C++
9 49 (6.24%) Rust
10 42 (5.35%) Bicep
11 39 (4.97%) C#
12 37 (4.71%) TypeScript
13 16 (2.04%) Shell Script
14 15 (1.91%) PL/SQL
15 7 (0.89%) PHP
16 6 (0.76%) Scala
17 3 (0.38%) Groovy
17 3 (0.38%) T-SQL
18 2 (0.25%) XAML
19 1 (0.13%) C
Qualifications
1 102 (12.99%) Security Cleared
2 59 (7.52%) DV Cleared
3 45 (5.73%) Azure Certification
3 45 (5.73%) SC Cleared
4 39 (4.97%) AWS Certification
5 19 (2.42%) Degree
6 17 (2.17%) Microsoft Certification
7 13 (1.66%) AWS Certified Solutions Architect
7 13 (1.66%) Cisco Certification
8 11 (1.40%) CCNP
9 9 (1.15%) Computer Science Degree
10 6 (0.76%) CISSP
10 6 (0.76%) RHCE
11 5 (0.64%) BPSS Clearance
11 5 (0.64%) TOGAF Certification
12 4 (0.51%) AWS Certified DevOps Engineer
12 4 (0.51%) AWS Certified SysOps Administrator
12 4 (0.51%) CCNA
13 2 (0.25%) CISA
13 2 (0.25%) CISM
Quality Assurance & Compliance
1 19 (2.42%) QA
2 14 (1.78%) ISO/IEC 27001
3 13 (1.66%) GDPR
4 12 (1.53%) NIST
5 8 (1.02%) Data Quality
6 5 (0.64%) PCI DSS
7 4 (0.51%) Accessibility
7 4 (0.51%) HIPAA
7 4 (0.51%) SOC 2
8 1 (0.13%) NCSC
8 1 (0.13%) PMO
8 1 (0.13%) SLA
System Software
1 470 (59.87%) Docker
2 276 (35.16%) Hyper-V
3 271 (34.52%) vSphere
4 265 (33.76%) VMware NSX
5 41 (5.22%) Active Directory
6 25 (3.18%) VMware Infrastructure
7 19 (2.42%) Virtual Machines
8 18 (2.29%) Virtual Desktop
9 7 (0.89%) Virtual Servers
10 6 (0.76%) NFS
11 2 (0.25%) Firmware
12 1 (0.13%) KVM
12 1 (0.13%) Xen
Systems Management
1 447 (56.94%) Ansible
2 251 (31.97%) Kubernetes
3 53 (6.75%) Grafana
4 43 (5.48%) Prometheus
5 23 (2.93%) Microsoft Intune
6 15 (1.91%) Single Sign-On
7 14 (1.78%) Istio
8 11 (1.40%) Argo
9 8 (1.02%) SCOM
10 4 (0.51%) Progress Chef
10 4 (0.51%) Puppet
10 4 (0.51%) SCCM
11 3 (0.38%) FortiGate
12 2 (0.25%) Dell DRAC
12 2 (0.25%) Kustomize
13 1 (0.13%) CFEngine
13 1 (0.13%) Failover Clustering
13 1 (0.13%) Packer
13 1 (0.13%) Salt
13 1 (0.13%) ZABBIX
Vendors
1 296 (37.71%) Cisco
2 264 (33.63%) Juniper
3 263 (33.50%) Splunk
4 262 (33.38%) 3PAR
5 97 (12.36%) Microsoft
6 43 (5.48%) VMware
7 25 (3.18%) Google
7 25 (3.18%) Oracle
8 20 (2.55%) Red Hat
9 19 (2.42%) Palo Alto
10 16 (2.04%) Databricks
10 16 (2.04%) Fortinet
11 15 (1.91%) Aruba
12 13 (1.66%) Mellanox
12 13 (1.66%) NVIDIA
13 9 (1.15%) Commvault
13 9 (1.15%) Rollbar
14 8 (1.02%) Okta
15 7 (0.89%) Pure Storage
15 7 (0.89%) SolarWinds