Law Jobs with Work from Home Options

Law
UK > Work from Home

The table below looks at the prevalence of the term Law in remote or hybrid work. Included is a benchmarking guide to the salaries offered in vacancies that cited Law over the 6 months leading up to 27 July 2024, comparing them to the same period in the previous two years.

6 months to
27 Jul 2024
Same period 2023 Same period 2022
Rank 94 130 178
Rank change year-on-year +36 +48 -1
Permanent jobs citing Law 838 865 1,856
As % of all permanent jobs with a WFH option 3.01% 2.65% 2.37%
As % of the General category 4.93% 4.07% 3.58%
Number of salaries quoted 574 713 981
10th Percentile £27,232 £33,750 £32,500
25th Percentile £40,000 £41,750 £42,000
Median annual salary (50th Percentile) £55,000 £55,000 £56,000
Median % change year-on-year - -1.79% +6.67%
75th Percentile £70,000 £70,000 £75,000
90th Percentile £82,125 £87,500 £92,500
UK median annual salary £51,000 £52,500 £52,500
% change year-on-year -2.86% - +5.00%

All General Skills
Work from Home

Law falls under the General Skills category. For comparison with the information above, the following table provides summary statistics for all permanent job vacancies with remote or hybrid options requiring common skills.

Permanent vacancies with a requirement for common skills 16,983 21,265 51,878
As % of all permanent jobs with a WFH option 60.91% 65.13% 66.11%
Number of salaries quoted 11,494 15,550 26,987
10th Percentile £32,500 £36,250 £35,000
25th Percentile £42,500 £46,533 £45,000
Median annual salary (50th Percentile) £57,500 £62,500 £60,000
Median % change year-on-year -8.00% +4.17% +7.14%
75th Percentile £77,500 £82,500 £80,000
90th Percentile £100,000 £102,500 £96,250
UK median annual salary £54,125 £60,000 £60,000
% change year-on-year -9.79% - +6.19%

Law
Trend for Jobs with a WFH Option

Job vacancies with a work from home option citing Law as a proportion of all IT jobs advertised.
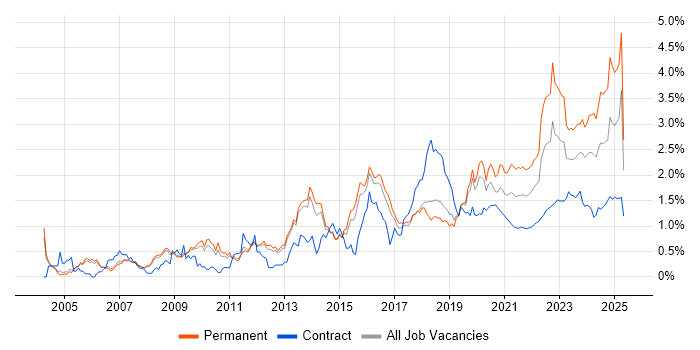
Law trend for jobs with a WFH option

Law
Salary Trend for Jobs with a WFH Option

3-month moving average salary quoted in job vacancies with a work from home option citing Law.

Law salary trend for jobs with a WFH option

Law
Salary Histogram for Jobs with a WFH Option

Salary distribution for jobs with a work from home option citing Law over the 6 months to 27 July 2024.

Law salary histogram for jobs with a WFH option

Law
Co-occurring Skills and Capabilities with WFH Options by Category

The follow tables expand on the table above by listing co-occurrences grouped by category. The same employment type, locality and period is covered with up to 20 co-occurrences shown in each of the following categories:

Application Platforms
1 42 (5.01%) SharePoint
2 21 (2.51%) Microsoft Exchange
3 16 (1.91%) IIS
4 10 (1.19%) CMS
5 8 (0.95%) Confluence
6 7 (0.84%) BizTalk Server
7 5 (0.60%) WordPress
8 4 (0.48%) Apache Airflow
9 3 (0.36%) SAS
10 2 (0.24%) Apache
11 1 (0.12%) Camunda
11 1 (0.12%) Documentum
11 1 (0.12%) nginx
11 1 (0.12%) SharePoint Server
Applications
1 59 (7.04%) Microsoft Office
2 42 (5.01%) Microsoft Excel
3 20 (2.39%) Microsoft PowerPoint
4 8 (0.95%) MS Visio
5 5 (0.60%) Chatbot
6 4 (0.48%) Adobe Illustrator
7 3 (0.36%) AutoCAD
7 3 (0.36%) SketchUp
7 3 (0.36%) SOLIDWORKS
8 2 (0.24%) Spreadsheet
9 1 (0.12%) Adobe Creative Suite
9 1 (0.12%) Adobe Premiere
9 1 (0.12%) Microsoft Project
9 1 (0.12%) Photoshop
9 1 (0.12%) SPSS
Business Applications
1 18 (2.15%) Visualfiles
2 13 (1.55%) Remedy ITSM
3 11 (1.31%) Elite 3E
4 9 (1.07%) Dynamics CRM
5 5 (0.60%) Relativity
6 4 (0.48%) Carpe Diem
7 3 (0.36%) Dynamics AX
7 3 (0.36%) Dynamics NAV
7 3 (0.36%) Oracle Payables
7 3 (0.36%) Oracle Receivables
8 2 (0.24%) BambooHR
8 2 (0.24%) iTrent
8 2 (0.24%) Oracle EBS
8 2 (0.24%) Oracle ERP
8 2 (0.24%) Oracle Financials
9 1 (0.12%) Primavera
9 1 (0.12%) ProductWriter
Cloud Services
1 181 (21.60%) Azure
2 111 (13.25%) Microsoft 365
3 108 (12.89%) AWS
4 65 (7.76%) Dynamics 365
5 58 (6.92%) Power Platform
6 52 (6.21%) GCP
7 47 (5.61%) SaaS
8 38 (4.53%) Entra ID
9 28 (3.34%) Amazon EKS
10 21 (2.51%) Power Automate
11 20 (2.39%) Azure DevOps
11 20 (2.39%) PowerApps
12 19 (2.27%) OCI
13 13 (1.55%) PaaS
14 12 (1.43%) Azure Storage
15 11 (1.31%) Azure Monitor
16 10 (1.19%) Azure Logic Apps
16 10 (1.19%) Google Analytics
17 9 (1.07%) Amazon ECS
18 8 (0.95%) Serverless
Communications & Networking
1 41 (4.89%) Firewall
2 17 (2.03%) Intrusion Detection
3 14 (1.67%) TCP/IP
4 12 (1.43%) BGP
5 11 (1.31%) LAN
6 10 (1.19%) VLAN
6 10 (1.19%) VPN
6 10 (1.19%) WAN
7 9 (1.07%) MPLS
7 9 (1.07%) OSPF
8 7 (0.84%) Internet
8 7 (0.84%) SD-WAN
8 7 (0.84%) Skype
9 6 (0.72%) DNS
9 6 (0.72%) Ethernet
9 6 (0.72%) Network Security
9 6 (0.72%) Wi-Fi
10 5 (0.60%) VoIP
11 4 (0.48%) DHCP
11 4 (0.48%) Intranet
Database & Business Intelligence
1 58 (6.92%) SQL Server
2 44 (5.25%) Relational Database
3 35 (4.18%) MySQL
4 34 (4.06%) Power BI
5 18 (2.15%) Data Warehouse
6 15 (1.79%) SQL Server Reporting Services
7 13 (1.55%) BigQuery
8 8 (0.95%) MongoDB
9 7 (0.84%) Amazon RDS
10 6 (0.72%) EDRMS
11 5 (0.60%) Hadoop
11 5 (0.60%) Oracle Database
12 4 (0.48%) Oracle Reports
12 4 (0.48%) RDBMS
12 4 (0.48%) SAP HANA
12 4 (0.48%) SQL Server Integration Services
13 3 (0.36%) Azure SQL Database
13 3 (0.36%) PostgreSQL
13 3 (0.36%) Tableau
14 2 (0.24%) QlikView
Development Applications
1 24 (2.86%) TeamCity
2 17 (2.03%) Git
2 17 (2.03%) JIRA
3 15 (1.79%) Maven
3 15 (1.79%) Visual Studio
4 12 (1.43%) Bitbucket
5 7 (0.84%) Jenkins
6 6 (0.72%) Selenium
7 5 (0.60%) GitLab
7 5 (0.60%) Team Foundation Server
8 3 (0.36%) Cucumber
8 3 (0.36%) JUnit
9 2 (0.24%) Atlassian Bamboo
9 2 (0.24%) Cypress.io
9 2 (0.24%) Eclipse
10 1 (0.12%) WebDriver
General
1 257 (30.67%) Social Skills
2 189 (22.55%) Legal
3 159 (18.97%) Finance
4 113 (13.48%) Inclusion and Diversity
5 84 (10.02%) Analytical Skills
6 77 (9.19%) Banking
7 70 (8.35%) Retail
8 44 (5.25%) Marketing
9 30 (3.58%) Pharmaceutical
10 28 (3.34%) Presentation Skills
11 17 (2.03%) Documentation Skills
12 15 (1.79%) Investment Banking
12 15 (1.79%) Publishing
13 14 (1.67%) Telecoms
14 13 (1.55%) Aerospace
14 13 (1.55%) Organisational Skills
15 10 (1.19%) Back Office
15 10 (1.19%) Financial Institution
16 9 (1.07%) Police
17 8 (0.95%) Public Sector
Job Titles
1 151 (18.02%) Developer
2 147 (17.54%) Analyst
3 82 (9.79%) Senior
4 49 (5.85%) IT Technician
5 47 (5.61%) Lead
6 45 (5.37%) Help Desk Technician
7 39 (4.65%) Software Engineer
8 30 (3.58%) IT Manager
9 29 (3.46%) Systems Analyst
10 28 (3.34%) Architect
11 26 (3.10%) Cloud Engineer
11 26 (3.10%) Consultant
12 23 (2.74%) .NET Developer
13 20 (2.39%) Data Engineer
14 19 (2.27%) Junior
14 19 (2.27%) Security Analyst
15 18 (2.15%) Java Engineer
15 18 (2.15%) Support Analyst
16 17 (2.03%) Business Analyst
16 17 (2.03%) IT Analyst
Libraries, Frameworks & Software Standards
1 80 (9.55%) .NET
2 77 (9.19%) HTML
3 57 (6.80%) React
4 51 (6.09%) CSS
5 38 (4.53%) REST
6 27 (3.22%) Oracle Fusion
7 25 (2.98%) Web Services
7 25 (2.98%) XML
8 23 (2.74%) ASP.NET
8 23 (2.74%) SOAP
9 21 (2.51%) Node.js
10 19 (2.27%) AngularJS
11 17 (2.03%) Spring
12 16 (1.91%) Symfony
13 15 (1.79%) .NET Framework
13 15 (1.79%) Spring Boot
14 14 (1.67%) RESTful
15 13 (1.55%) KnockoutJS
15 13 (1.55%) Twitter Bootstrap
16 12 (1.43%) JSON
Miscellaneous
1 50 (5.97%) Blog
2 46 (5.49%) Housing Association
3 45 (5.37%) Cloud Native
4 34 (4.06%) Management Information System
5 29 (3.46%) Data Centre
6 17 (2.03%) Enterprise Software
6 17 (2.03%) Onboarding
6 17 (2.03%) Self-Motivation
7 15 (1.79%) Distributed Applications
7 15 (1.79%) Mobile App
8 13 (1.55%) Foreign Exchange (FX)
8 13 (1.55%) Linux Command Line
8 13 (1.55%) Public Cloud
9 12 (1.43%) Greenfield Project
10 11 (1.31%) Distributed Systems
10 11 (1.31%) Legacy Systems
10 11 (1.31%) Virtual Team
11 10 (1.19%) Social Media
12 9 (1.07%) Legacy Code
13 8 (0.95%) CMDB
Operating Systems
1 82 (9.79%) Windows
2 33 (3.94%) Linux
3 17 (2.03%) Windows 10
4 15 (1.79%) Windows Server
5 11 (1.31%) Apple iOS
6 8 (0.95%) Android
6 8 (0.95%) Windows Server 2016
7 6 (0.72%) Windows Server 2012
7 6 (0.72%) Windows Server 2019
8 4 (0.48%) Unix
8 4 (0.48%) Windows 7
9 3 (0.36%) Mac OS
10 2 (0.24%) Windows 8
10 2 (0.24%) Windows Server 2008
Processes & Methodologies
1 134 (15.99%) Agile
2 107 (12.77%) Problem-Solving
3 95 (11.34%) Cybersecurity
4 81 (9.67%) Software Engineering
5 77 (9.19%) DevOps
6 67 (8.00%) Mentoring
7 66 (7.88%) Information Security
8 63 (7.52%) Line Management
9 62 (7.40%) Continuous Improvement
10 60 (7.16%) Fintech
11 58 (6.92%) Project Management
12 57 (6.80%) Analytics
12 57 (6.80%) Change Management
13 54 (6.44%) CI/CD
13 54 (6.44%) Customer Service
14 53 (6.32%) ITIL
15 46 (5.49%) Business Intelligence
16 45 (5.37%) Disruptive Innovation
17 44 (5.25%) Test Automation
18 42 (5.01%) Stakeholder Management
Programming Languages
1 150 (17.90%) SQL
2 83 (9.90%) JavaScript
3 82 (9.79%) Python
4 74 (8.83%) C#
5 64 (7.64%) Java
6 49 (5.85%) T-SQL
7 38 (4.53%) PowerShell
8 25 (2.98%) PHP
9 18 (2.15%) TypeScript
10 15 (1.79%) Groovy
11 13 (1.55%) Bash
12 11 (1.31%) Go
12 11 (1.31%) VB.NET
13 8 (0.95%) Bicep
13 8 (0.95%) XPath
14 7 (0.84%) R
15 6 (0.72%) VBA
16 4 (0.48%) PL/SQL
17 2 (0.24%) C
17 2 (0.24%) VB
Qualifications
1 147 (17.54%) Degree
2 62 (7.40%) Security Cleared
3 38 (4.53%) CISSP
4 28 (3.34%) Master's Degree
5 25 (2.98%) SC Cleared
6 22 (2.63%) CISM
7 19 (2.27%) CISA
8 18 (2.15%) Azure Certification
9 13 (1.55%) Computer Science Degree
10 11 (1.31%) ISO 27001 Lead Auditor
11 10 (1.19%) CEH
11 10 (1.19%) CompTIA Security+
12 9 (1.07%) MBA
12 9 (1.07%) Microsoft Certification
13 7 (0.84%) CIPD
13 7 (0.84%) CREST Certified
13 7 (0.84%) PhD
13 7 (0.84%) SSCP
14 5 (0.60%) CompTIA CySA+
14 5 (0.60%) GSEC
Quality Assurance & Compliance
1 47 (5.61%) ISO/IEC 27001
2 34 (4.06%) GDPR
3 26 (3.10%) QA
4 25 (2.98%) Cyber Essentials
5 21 (2.51%) NIST
6 17 (2.03%) PCI DSS
7 15 (1.79%) GRC
8 14 (1.67%) Data Quality
9 9 (1.07%) ISO/IEC 27002 (supersedes ISO/IEC 17799)
10 8 (0.95%) Cyber Essentials PLUS
11 5 (0.60%) GMP
11 5 (0.60%) PMO
12 4 (0.48%) SLA
12 4 (0.48%) SOC 2
13 3 (0.36%) Accessibility
14 2 (0.24%) COBIT
14 2 (0.24%) IASME
15 1 (0.12%) ISO 9001
15 1 (0.12%) NCSC
15 1 (0.12%) P3O
System Software
1 52 (6.21%) Active Directory
2 10 (1.19%) VMware Infrastructure
3 9 (1.07%) Docker
4 4 (0.48%) Hyper-V
4 4 (0.48%) Terminal Services
5 2 (0.24%) Citrix Hypervisor
5 2 (0.24%) Microsoft App-V
5 2 (0.24%) VMware ESXi
5 2 (0.24%) VMware NSX
6 1 (0.12%) Firmware
6 1 (0.12%) Snort
6 1 (0.12%) Virtual Machines
6 1 (0.12%) vSphere
Systems Management
1 44 (5.25%) Terraform
2 37 (4.42%) Kubernetes
3 19 (2.27%) Grafana
4 10 (1.19%) Microsoft Intune
5 7 (0.84%) Ansible
6 5 (0.60%) logstash
6 5 (0.60%) Single Sign-On
7 4 (0.48%) Progress Chef
8 3 (0.36%) AirWatch
8 3 (0.36%) SCCM
9 2 (0.24%) Nessus
9 2 (0.24%) QRadar
9 2 (0.24%) SysTrack
9 2 (0.24%) vCenter Server
10 1 (0.12%) Active Directory Federation Services
10 1 (0.12%) Argo
10 1 (0.12%) SCOM
10 1 (0.12%) SCOrch
10 1 (0.12%) vRealize
10 1 (0.12%) vRealize Orchestrator
Vendors
1 195 (23.27%) Microsoft
2 45 (5.37%) Oracle
3 33 (3.94%) iManage
4 27 (3.22%) Google
5 24 (2.86%) SAP
6 23 (2.74%) ServiceNow
7 17 (2.03%) Citrix
7 17 (2.03%) Intapp
8 13 (1.55%) BMC
8 13 (1.55%) Cisco
8 13 (1.55%) Remedy
8 13 (1.55%) VMware
9 12 (1.43%) Aderant
10 8 (0.95%) UiPath
11 7 (0.84%) CyberArk
12 6 (0.72%) Databricks
12 6 (0.72%) DocuSign
12 6 (0.72%) Palo Alto
12 6 (0.72%) SolarWinds
12 6 (0.72%) Ubiquiti