Hybrid/Remote SQL Server Job Trends

Microsoft SQL Server (MS SQL)
UK > Work from Home

The table below provides summary statistics and salary benchmarking for remote or hybrid work requiring SQL Server skills. It covers permanent job vacancies from the 6 months leading up to 24 October 2025, with comparisons to the same periods in the previous two years.

6 months to
24 Oct 2025
Same period 2024 Same period 2023
Rank 66 54 34
Rank change year-on-year -12 -20 +6
Permanent jobs citing SQL Server 755 956 1,699
As % of all permanent jobs with remote/hybrid work options 4.62% 4.74% 7.39%
As % of the Database & Business Intelligence category 29.68% 20.55% 29.57%
Number of salaries quoted 433 615 1,496
10th Percentile £30,100 £31,250 £38,063
25th Percentile £37,500 £42,500 £47,500
Median annual salary (50th Percentile) £52,500 £55,000 £57,000
Median % change year-on-year -4.55% -3.51% +3.64%
75th Percentile £72,500 £70,000 £70,000
90th Percentile £87,250 £82,500 £82,500
UK median annual salary £55,000 £55,000 £57,500
% change year-on-year - -4.35% +4.55%

All Database and Business Intelligence Skills
Work from Home

SQL Server falls under the Databases and Business Intelligence category. For comparison with the information above, the following table provides summary statistics for all permanent job vacancies with remote or hybrid options requiring database or business intelligence skills.

Permanent vacancies with a requirement for database or business intelligence skills 2,544 4,652 5,746
As % of all permanent jobs with a WFH option 15.56% 23.06% 24.99%
Number of salaries quoted 1,765 2,830 4,640
10th Percentile £35,500 £39,975 £39,294
25th Percentile £45,000 £48,750 £47,500
Median annual salary (50th Percentile) £60,000 £70,000 £60,000
Median % change year-on-year -14.29% +16.67% -
75th Percentile £82,500 £95,000 £77,715
90th Percentile £110,000 £122,500 £94,550
UK median annual salary £60,000 £65,000 £60,000
% change year-on-year -7.69% +8.33% -

SQL Server
Job Vacancy Trend for Remote/Hybrid Jobs

Historical trend showing the proportion of permanent IT job postings citing SQL Server and offering remote or hybrid work options relative to all permanent IT jobs advertised.

SQL Server job vacancy trend for remote/hybrid jobs

SQL Server
Salary Trend for Remote/Hybrid Jobs

Salary distribution trend for jobs with remote/hybrid work options citing SQL Server.
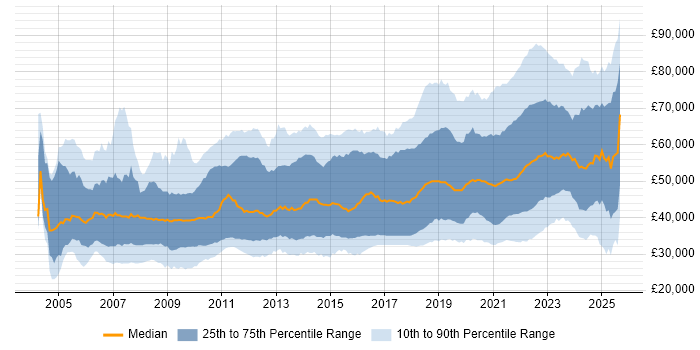
Salary distribution trend for jobs with remote/hybrid work options citing SQL Server

SQL Server
Salary Histogram for Remote/Hybrid Jobs

Salary distribution for jobs with remote/hybrid work options citing SQL Server over the 6 months to 24 October 2025.

SQL Server salary histogram for jobs with remote/hybrid work options

SQL Server
Co-Occurring Skills & Capabilities in Remote/Hybrid Jobs by Category

The following tables expand on the one above by listing co-occurrences grouped by category. They cover the same employment type, locality and period, with up to 20 co-occurrences shown in each category:

Application Platforms
1 172 (22.78%) Confluence
2 54 (7.15%) IIS
3 26 (3.44%) Microsoft Exchange
4 19 (2.52%) SharePoint
5 14 (1.85%) Tomcat
6 7 (0.93%) CMS
6 7 (0.93%) Moodle
7 6 (0.79%) WebSphere
7 6 (0.79%) WebSphere Application Server
8 4 (0.53%) nginx
8 4 (0.53%) Oracle Workflow
9 2 (0.26%) BizTalk Server
9 2 (0.26%) HCL Notes
9 2 (0.26%) Oracle SOA Suite
9 2 (0.26%) Skype for Business
10 1 (0.13%) Apache
10 1 (0.13%) Apache Airflow
10 1 (0.13%) GeoServer
10 1 (0.13%) NServiceBus
10 1 (0.13%) SAS
Applications
1 20 (2.65%) Microsoft Office
2 17 (2.25%) Microsoft Excel
3 4 (0.53%) Spreadsheet
4 3 (0.40%) AutoCAD
4 3 (0.40%) EPLAN
5 2 (0.26%) Chatbot
6 1 (0.13%) Adobe Illustrator
6 1 (0.13%) Microsoft Project
Business Applications
1 17 (2.25%) Dynamics CRM
2 16 (2.12%) Unit4 Business World
3 13 (1.72%) Dynamics NAV
4 7 (0.93%) Infor CloudSuite
4 7 (0.93%) Infor CloudSuite Industrial (formerly SyteLine)
5 5 (0.66%) NetSuite
6 4 (0.53%) NEC Housing
6 4 (0.53%) Sage 1000
7 3 (0.40%) Salesforce CRM
8 2 (0.26%) Markit EDM
8 2 (0.26%) Oracle BPM
9 1 (0.13%) ION Anvil
9 1 (0.13%) Magento
Cloud Services
1 512 (67.81%) Azure
2 321 (42.52%) AWS
3 176 (23.31%) GCP
4 89 (11.79%) Power Platform
5 71 (9.40%) Azure DevOps
6 69 (9.14%) SaaS
7 61 (8.08%) GitHub
8 43 (5.70%) Microsoft 365
9 32 (4.24%) Dynamics 365
10 30 (3.97%) Azure Data Factory
10 30 (3.97%) Serverless
11 25 (3.31%) Power Automate
12 22 (2.91%) Entra ID
13 18 (2.38%) GitHub Actions
14 17 (2.25%) PowerApps
15 13 (1.72%) Azure Cosmos DB
15 13 (1.72%) PaaS
16 12 (1.59%) Cloudflare
17 11 (1.46%) Azure Service Bus
18 9 (1.19%) Azure App Service
Communications & Networking
1 20 (2.65%) Firewall
2 14 (1.85%) TCP/IP
3 13 (1.72%) SSL
4 12 (1.59%) DNS
5 10 (1.32%) VPN
6 8 (1.06%) DHCP
7 7 (0.93%) DMARC
8 6 (0.79%) VLAN
8 6 (0.79%) VoIP
9 5 (0.66%) DMZ
9 5 (0.66%) SAN
9 5 (0.66%) STUN
10 3 (0.40%) Internet
10 3 (0.40%) WAN
10 3 (0.40%) Wi-Fi
11 2 (0.26%) Broadband
11 2 (0.26%) HTTP
11 2 (0.26%) LAN
11 2 (0.26%) SD-WAN
11 2 (0.26%) Skype
Database & Business Intelligence
1 91 (12.05%) MySQL
2 81 (10.73%) Power BI
3 52 (6.89%) SQL Server Integration Services
4 48 (6.36%) PostgreSQL
5 45 (5.96%) MongoDB
5 45 (5.96%) SQL Server Reporting Services
6 39 (5.17%) Data Warehouse
7 35 (4.64%) Relational Database
8 21 (2.78%) Azure SQL Database
9 18 (2.38%) NoSQL
10 17 (2.25%) Elasticsearch
11 16 (2.12%) Data Hub
11 16 (2.12%) SQL CLR
11 16 (2.12%) SQL Server Analysis Services
12 13 (1.72%) Tableau
13 10 (1.32%) DB2
13 10 (1.32%) RDBMS
14 9 (1.19%) Amazon RDS
15 7 (0.93%) Crystal Reports
16 6 (0.79%) Amazon Redshift
Development Applications
1 269 (35.63%) JIRA
2 253 (33.51%) GitLab
3 252 (33.38%) Bitbucket
4 251 (33.25%) SonarQube
5 249 (32.98%) Selenium
6 248 (32.85%) Maven
7 247 (32.72%) Cucumber
7 247 (32.72%) Sonatype Nexus
8 91 (12.05%) Git
9 14 (1.85%) SQL Server Management Studio (SSMS)
10 12 (1.59%) TeamCity
11 9 (1.19%) NUnit
12 8 (1.06%) Octopus Deploy
13 7 (0.93%) Jasmine
14 6 (0.79%) Visual Studio
15 5 (0.66%) Jenkins
16 4 (0.53%) Browser DevTools
16 4 (0.53%) Team Foundation Server
16 4 (0.53%) Toad
17 3 (0.40%) Visual Studio Code
General
1 375 (49.67%) Finance
2 264 (34.97%) Inclusion and Diversity
3 262 (34.70%) Banking
4 202 (26.75%) Social Skills
5 120 (15.89%) Retail
6 91 (12.05%) Investment Banking
7 90 (11.92%) Corporate Banking
8 56 (7.42%) Analytical Skills
9 35 (4.64%) Back Office
10 27 (3.58%) Law
11 26 (3.44%) Public Sector
12 25 (3.31%) Documentation Skills
12 25 (3.31%) Manufacturing
13 20 (2.65%) Front Office
14 18 (2.38%) Marketing
15 17 (2.25%) Games
16 11 (1.46%) Legal
17 10 (1.32%) Presentation Skills
18 7 (0.93%) Czech Language
18 7 (0.93%) Organisational Skills
Job Titles
1 266 (35.23%) Software Engineer
2 237 (31.39%) Developer
3 84 (11.13%) Senior
4 64 (8.48%) .NET Developer
5 55 (7.28%) Analyst
6 49 (6.49%) Senior Developer
7 44 (5.83%) Graduate
8 42 (5.56%) IT Graduate
9 40 (5.30%) C# Developer
10 39 (5.17%) Graduate Developer
10 39 (5.17%) Lead
11 35 (4.64%) SQL Developer
12 34 (4.50%) Full-Stack Developer
13 33 (4.37%) Applications Support
13 33 (4.37%) Support Engineer
14 28 (3.71%) DBA
14 28 (3.71%) Software Developer
15 25 (3.31%) Administrator
16 24 (3.18%) IT Support
16 24 (3.18%) SaaS Developer
Libraries, Frameworks & Software Standards
1 339 (44.90%) CSS
2 300 (39.74%) HTML
3 297 (39.34%) React
4 258 (34.17%) Kafka
5 252 (33.38%) Spring
5 252 (33.38%) Spring Boot
6 249 (32.98%) Redux
7 248 (32.85%) JPA
8 238 (31.52%) .NET
9 157 (20.79%) Hibernate
10 140 (18.54%) REST
11 123 (16.29%) RESTful
12 105 (13.91%) HTML5
13 103 (13.64%) CSS3
14 97 (12.85%) Jest
15 91 (12.05%) Sass
16 75 (9.93%) ASP.NET
17 70 (9.27%) .NET Framework
18 67 (8.87%) .NET Core
19 50 (6.62%) Entity Framework
Miscellaneous
1 268 (35.50%) Enterprise Software
2 252 (33.38%) Product Ownership
3 36 (4.77%) Self-Motivation
4 19 (2.52%) Cloud Native
5 17 (2.25%) NHS
6 16 (2.12%) Private Cloud
7 15 (1.99%) Legacy Systems
7 15 (1.99%) Virtual Team
8 13 (1.72%) Onboarding
9 12 (1.59%) Linux Command Line
10 10 (1.32%) Client/Server
10 10 (1.32%) Driving Licence
10 10 (1.32%) Team-Oriented Environment
11 8 (1.06%) Management Information System
11 8 (1.06%) Mobile App
12 7 (0.93%) Learning Management System
13 6 (0.79%) BYOD
13 6 (0.79%) Data Structures
13 6 (0.79%) Replication
14 5 (0.66%) Clustering
Operating Systems
1 89 (11.79%) Windows
2 48 (6.36%) Windows Server
3 44 (5.83%) Linux
4 21 (2.78%) Unix
5 7 (0.93%) Red Hat Enterprise Linux
6 6 (0.79%) Mac OS
7 5 (0.66%) Debian
8 4 (0.53%) Android
9 3 (0.40%) Apple iOS
9 3 (0.40%) Windows Server 2019
10 2 (0.26%) Solaris
10 2 (0.26%) Ubuntu
10 2 (0.26%) VMS
10 2 (0.26%) Windows Server 2003
11 1 (0.13%) AIX
11 1 (0.13%) Windows 10
11 1 (0.13%) Windows Server 2012
11 1 (0.13%) Windows Server 2016
Processes & Methodologies
1 444 (58.81%) Agile
2 374 (49.54%) DevOps
3 352 (46.62%) CI/CD
4 325 (43.05%) Full-Stack Development
5 318 (42.12%) Software Engineering
6 316 (41.85%) Microservices
7 284 (37.62%) Test Automation
8 278 (36.82%) SDLC
9 276 (36.56%) Performance Optimisation
10 273 (36.16%) Containerisation
11 271 (35.89%) Front End Development
12 259 (34.30%) Continuous Improvement
13 226 (29.93%) Clean Code
14 174 (23.05%) TDD
15 171 (22.65%) Problem-Solving
16 161 (21.32%) Mentoring
17 119 (15.76%) Migration
18 106 (14.04%) Business Intelligence
18 106 (14.04%) Strategic Thinking
19 101 (13.38%) User Experience
Programming Languages
1 523 (69.27%) SQL
2 360 (47.68%) JavaScript
3 314 (41.59%) Java
4 235 (31.13%) C#
5 123 (16.29%) TypeScript
6 54 (7.15%) Python
7 51 (6.75%) T-SQL
8 50 (6.62%) PowerShell
9 49 (6.49%) PHP
10 42 (5.56%) C++
11 20 (2.65%) VB.NET
12 13 (1.72%) C
13 12 (1.59%) VBA
14 9 (1.19%) Bicep
15 7 (0.93%) Shell Script
16 6 (0.79%) VB
17 5 (0.66%) Data Analysis Expressions
17 5 (0.66%) PL/SQL
18 3 (0.40%) Kotlin
18 3 (0.40%) Swift
Qualifications
1 132 (17.48%) Degree
2 78 (10.33%) Computer Science Degree
3 19 (2.52%) Security Cleared
4 15 (1.99%) Master's Degree
5 13 (1.72%) SC Cleared
6 11 (1.46%) Microsoft Certification
7 9 (1.19%) AWS Certification
8 8 (1.06%) DBS Check
9 6 (0.79%) ITIL Certification
10 5 (0.66%) Azure Certification
11 3 (0.40%) BPSS Clearance
11 3 (0.40%) DV Cleared
12 2 (0.26%) ACCA
12 2 (0.26%) CCNA
12 2 (0.26%) CCNP
12 2 (0.26%) Cisco Certification
12 2 (0.26%) CISSP
12 2 (0.26%) MCP
12 2 (0.26%) MCSA
12 2 (0.26%) MCSE
Quality Assurance & Compliance
1 288 (38.15%) QA
2 104 (13.77%) Accessibility
3 29 (3.84%) ISO/IEC 27001
4 20 (2.65%) Data Quality
5 18 (2.38%) GDPR
6 17 (2.25%) ISO 9001
7 8 (1.06%) SLA
8 5 (0.66%) Cyber Essentials
9 1 (0.13%) HIPAA
9 1 (0.13%) ISO 20022
9 1 (0.13%) MiFID
9 1 (0.13%) SEPA
System Software
1 289 (38.28%) Docker
2 34 (4.50%) Active Directory
3 26 (3.44%) VMware Infrastructure
4 8 (1.06%) Virtual Machines
5 5 (0.66%) Kamailio
6 4 (0.53%) Hyper-V
7 3 (0.40%) vSphere
8 2 (0.26%) XenApp
9 1 (0.13%) Virtual Desktop
9 1 (0.13%) VMware ESXi
Systems Management
1 284 (37.62%) Kubernetes
2 27 (3.58%) Terraform
3 10 (1.32%) Microsoft Intune
4 8 (1.06%) Prometheus
4 8 (1.06%) SCCM
4 8 (1.06%) Single Sign-On
5 7 (0.93%) Ansible
5 7 (0.93%) Grafana
6 6 (0.79%) Failover Clustering
7 3 (0.40%) Functional Safety
8 2 (0.26%) SCOM
8 2 (0.26%) SCOrch
8 2 (0.26%) SCSM
9 1 (0.13%) Active Directory Federation Services
9 1 (0.13%) Kibana
9 1 (0.13%) logstash
9 1 (0.13%) vCenter Server
9 1 (0.13%) ZABBIX
Vendors
1 247 (32.72%) Solace
2 222 (29.40%) Microsoft
3 43 (5.70%) Oracle
4 31 (4.11%) VMware
5 29 (3.84%) Salesforce
6 16 (2.12%) DevExpress
7 14 (1.85%) Databricks
8 13 (1.72%) Google
9 10 (1.32%) Rollbar
9 10 (1.32%) Talend
10 9 (1.19%) OpenAI
10 9 (1.19%) Sage
10 9 (1.19%) Zoho
11 8 (1.06%) HubSpot
11 8 (1.06%) Red Hat
11 8 (1.06%) ServiceNow
12 7 (0.93%) Infor
13 6 (0.79%) Fortinet
13 6 (0.79%) Informatica
13 6 (0.79%) Trayport