Greenfield Project Jobs with Hybrid/Remote/WFH Options

Greenfield Project
UK > Work from Home

The table below looks at the prevalence of the term Greenfield Project in remote or hybrid work. Included is a benchmarking guide to the salaries offered in vacancies that cited Greenfield Project over the 6 months leading up to 1 May 2025, comparing them to the same period in the previous two years.

6 months to
1 May 2025
Same period 2024 Same period 2023
Rank 253 158 127
Rank change year-on-year -95 -31 -44
Permanent jobs citing Greenfield Project 152 702 1,143
As % of all permanent jobs with a WFH option 1.02% 2.07% 2.67%
As % of the Miscellaneous category 2.60% 5.84% 6.93%
Number of salaries quoted 128 683 1,091
10th Percentile £42,500 £38,550 £42,500
25th Percentile £47,500 £46,250 £52,500
Median annual salary (50th Percentile) £65,000 £57,500 £70,000
Median % change year-on-year +13.04% -17.86% -
75th Percentile £87,813 £80,000 £92,500
90th Percentile £107,500 £100,000 £112,500
UK median annual salary £70,000 £62,500 £70,000
% change year-on-year +12.00% -10.71% -

All Generic Skills
Work from Home

Greenfield Project falls under the General and Transferable Skills category. For comparison with the information above, the following table provides summary statistics for all permanent job vacancies with remote or hybrid options requiring generic IT skills.

Permanent vacancies with a requirement for generic IT skills 5,843 12,025 16,498
As % of all permanent jobs with a WFH option 39.07% 35.54% 38.59%
Number of salaries quoted 3,833 9,250 11,895
10th Percentile £35,000 £32,500 £39,000
25th Percentile £47,231 £42,500 £48,750
Median annual salary (50th Percentile) £64,750 £59,300 £65,000
Median % change year-on-year +9.19% -8.77% -
75th Percentile £85,000 £78,750 £86,250
90th Percentile £122,500 £101,250 £107,500
UK median annual salary £60,000 £55,000 £65,000
% change year-on-year +9.09% -15.38% +4.00%

Greenfield Project
Trend for Jobs with a WFH Option

Job vacancies with remote working options citing Greenfield Project as a proportion of all IT jobs advertised.
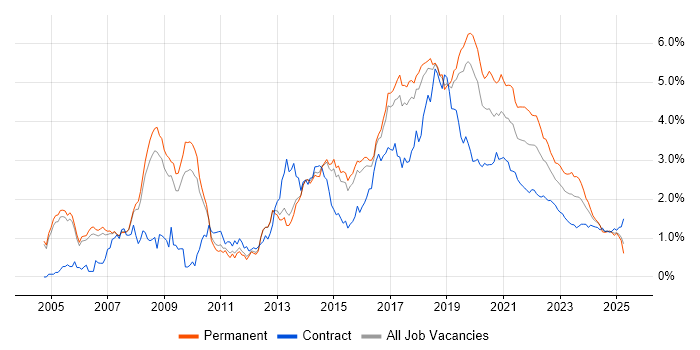
Greenfield Project trend for jobs with Hybrid/Remote/WFH options

Greenfield Project
Salary Trend for Jobs with a WFH Option

3-month moving average salary quoted in job vacancies with remote working options citing Greenfield Project.

Greenfield Project salary trend for jobs with a WFH option

Greenfield Project
Salary Histogram for Jobs with a WFH Option

Salary distribution for jobs with remote working options citing Greenfield Project over the 6 months to 1 May 2025.

Greenfield Project salary histogram for jobs with a WFH option

Greenfield Project
Co-occurring Skills and Capabilities with WFH Options by Category

The follow tables expand on the table above by listing co-occurrences grouped by category. The same employment type, locality and period is covered with up to 20 co-occurrences shown in each of the following categories:

Application Platforms
1 2 (1.32%) Apache Spark
1 2 (1.32%) Confluence
2 1 (0.66%) Apache
2 1 (0.66%) Apache Airflow
2 1 (0.66%) Oracle SOA Suite
Applications
1 1 (0.66%) Microsoft Office
Business Applications
1 11 (7.24%) Payment Gateway
2 6 (3.95%) Dynamics CRM
3 1 (0.66%) SAP LE
3 1 (0.66%) SAP S/4HANA
Cloud Services
1 47 (30.92%) Azure
2 43 (28.29%) AWS
3 14 (9.21%) GitHub
4 12 (7.89%) Amazon ECS
5 10 (6.58%) Entra ID
5 10 (6.58%) Serverless
6 9 (5.92%) Power Platform
7 7 (4.61%) Azure DevOps
8 6 (3.95%) Amazon CloudWatch
8 6 (3.95%) Dynamics 365
8 6 (3.95%) GCP
9 5 (3.29%) Figma
9 5 (3.29%) GitHub Actions
9 5 (3.29%) PowerApps
9 5 (3.29%) SaaS
10 3 (1.97%) Amazon EKS
10 3 (1.97%) Amazon EventBridge
10 3 (1.97%) Amazon SQS
10 3 (1.97%) AWS CloudFormation
10 3 (1.97%) AWS Lambda
Communications & Networking
1 3 (1.97%) Bluetooth
1 3 (1.97%) Wi-Fi
1 3 (1.97%) Wireless
2 2 (1.32%) HTTP
3 1 (0.66%) Multicast
3 1 (0.66%) TCP/IP
Database & Business Intelligence
1 22 (14.47%) MySQL
2 11 (7.24%) Relational Database
3 10 (6.58%) MongoDB
3 10 (6.58%) SQL Server
4 9 (5.92%) PostgreSQL
5 6 (3.95%) Amazon Athena
5 6 (3.95%) NoSQL
6 5 (3.29%) Redis
7 4 (2.63%) Power BI
7 4 (2.63%) RDBMS
8 3 (1.97%) Amazon Aurora
8 3 (1.97%) DynamoDB
9 2 (1.32%) Big Data
9 2 (1.32%) Crystal Reports
9 2 (1.32%) Data Lake
10 1 (0.66%) Data Warehouse
10 1 (0.66%) HBase
10 1 (0.66%) Metadata
10 1 (0.66%) Snowflake Schema
10 1 (0.66%) Tableau
Development Applications
1 16 (10.53%) Git
2 14 (9.21%) Visual Studio
3 3 (1.97%) JIRA
4 2 (1.32%) Checkstyle
4 2 (1.32%) git-flow
4 2 (1.32%) Jenkins
4 2 (1.32%) SonarQube
5 1 (0.66%) Android Studio
5 1 (0.66%) gulp
5 1 (0.66%) Storybook
5 1 (0.66%) Team Foundation Server
5 1 (0.66%) webpack
5 1 (0.66%) Xcode
General
1 31 (20.39%) Finance
2 21 (13.82%) Social Skills
3 20 (13.16%) Retail
4 16 (10.53%) Law
5 13 (8.55%) Banking
6 12 (7.89%) Inclusion and Diversity
7 7 (4.61%) Games
8 5 (3.29%) Front Office
9 3 (1.97%) Electronics
9 3 (1.97%) Wearables
10 2 (1.32%) Legal
10 2 (1.32%) Local Government
11 1 (0.66%) Advertising
11 1 (0.66%) Aerospace
11 1 (0.66%) Analytical Skills
11 1 (0.66%) Billing
11 1 (0.66%) Financial Institution
11 1 (0.66%) Telecoms
Job Titles
1 74 (48.68%) Developer
2 45 (29.61%) Senior
3 35 (23.03%) Software Engineer
4 26 (17.11%) .NET Developer
4 26 (17.11%) Senior Developer
5 15 (9.87%) C# Developer
5 15 (9.87%) Full-Stack Developer
6 14 (9.21%) C# .NET Developer
7 11 (7.24%) Full-Stack .NET Developer
7 11 (7.24%) Full-Stack C# Developer
8 10 (6.58%) Lead
8 10 (6.58%) React Developer
8 10 (6.58%) Software Developer
9 9 (5.92%) Front-End Developer (Client-Side Developer)
10 8 (5.26%) Senior Software Engineer
11 7 (4.61%) Artificial Intelligence Engineer
12 6 (3.95%) Front-End Engineer (Client-Side Engineer)
12 6 (3.95%) Gen AI Engineer
12 6 (3.95%) Gen AI Software Engineer
13 5 (3.29%) Developer/Software Engineer
Libraries, Frameworks & Software Standards
1 53 (34.87%) .NET
2 32 (21.05%) React
3 19 (12.50%) .NET Core
4 15 (9.87%) Node.js
4 15 (9.87%) REST
5 13 (8.55%) AngularJS
5 13 (8.55%) ASP.NET Web API
6 10 (6.58%) .NET Framework
6 10 (6.58%) Kafka
7 9 (5.92%) RESTful
8 8 (5.26%) CSS
8 8 (5.26%) Redux
9 7 (4.61%) HTML
10 6 (3.95%) JSON
10 6 (3.95%) Lambda Expressions
11 5 (3.29%) OpenFin
12 4 (2.63%) ASP.NET
12 4 (2.63%) Blazor
12 4 (2.63%) GraphQL
12 4 (2.63%) React Native
Miscellaneous
1 13 (8.55%) Product Ownership
2 10 (6.58%) IoT
3 9 (5.92%) Cloud Native
4 8 (5.26%) Algorithms
4 8 (5.26%) Distributed Systems
4 8 (5.26%) Legacy Systems
4 8 (5.26%) Mobile App
5 6 (3.95%) Legacy Code
5 6 (3.95%) Public Cloud
6 5 (3.29%) Fixed Income
7 4 (2.63%) Embedded Systems
8 3 (1.97%) Client/Server
8 3 (1.97%) Data Centre
8 3 (1.97%) GNSS
8 3 (1.97%) Virtual Team
9 2 (1.32%) Self-Motivation
10 1 (0.66%) Distributed Applications
10 1 (0.66%) Distributed Architecture
10 1 (0.66%) Onboarding
10 1 (0.66%) Security Posture
Operating Systems
1 5 (3.29%) Android
1 5 (3.29%) Linux
2 3 (1.97%) FreeRTOS
2 3 (1.97%) Windows
3 1 (0.66%) Apple iOS
3 1 (0.66%) Unix
3 1 (0.66%) Windows Server
Processes & Methodologies
1 51 (33.55%) Software Engineering
2 34 (22.37%) Microservices
3 30 (19.74%) Agile
4 24 (15.79%) Full-Stack Development
5 21 (13.82%) Artificial Intelligence
5 21 (13.82%) CI/CD
5 21 (13.82%) DevOps
5 21 (13.82%) Problem-Solving
6 20 (13.16%) Front End Development
6 20 (13.16%) Mentoring
7 16 (10.53%) User Experience
8 15 (9.87%) Cybersecurity
8 15 (9.87%) Data Science
8 15 (9.87%) E-Commerce
8 15 (9.87%) Logistics
8 15 (9.87%) Web Development
9 14 (9.21%) Roadmaps
10 13 (8.55%) Fintech
10 13 (8.55%) Machine Learning
11 12 (7.89%) API Development
Programming Languages
1 60 (39.47%) C#
2 33 (21.71%) Python
3 32 (21.05%) TypeScript
4 29 (19.08%) SQL
5 27 (17.76%) JavaScript
6 19 (12.50%) Java
7 10 (6.58%) Kotlin
7 10 (6.58%) PHP
8 8 (5.26%) PowerShell
9 6 (3.95%) Clojure
9 6 (3.95%) Elixir
9 6 (3.95%) Rust
9 6 (3.95%) Scala
10 5 (3.29%) C
10 5 (3.29%) C++
11 4 (2.63%) Go
11 4 (2.63%) Perl
12 3 (1.97%) Embedded C
12 3 (1.97%) Embedded C++
13 2 (1.32%) Shell Script
Qualifications
1 16 (10.53%) Degree
2 6 (3.95%) Computer Science Degree
2 6 (3.95%) Numerate Degree
3 3 (1.97%) SC Cleared
3 3 (1.97%) Security Cleared
4 2 (1.32%) DV Cleared
Quality Assurance & Compliance
1 15 (9.87%) Accessibility
2 9 (5.92%) NIST
3 3 (1.97%) Data Quality
3 3 (1.97%) IEC 62304
3 3 (1.97%) ISO/IEC 27001
3 3 (1.97%) MISRA
3 3 (1.97%) PCI DSS
4 1 (0.66%) Actionable Recommendations
4 1 (0.66%) GDPR
System Software
1 9 (5.92%) Docker
2 6 (3.95%) Active Directory
3 1 (0.66%) Embedded Firmware
3 1 (0.66%) Firmware
3 1 (0.66%) HDFS
3 1 (0.66%) Virtual Machines
Systems Management
1 21 (13.82%) Kubernetes
2 12 (7.89%) Terraform
3 1 (0.66%) Ansible
Vendors
1 28 (18.42%) Microsoft
2 4 (2.63%) Okta
3 3 (1.97%) Oracle
4 1 (0.66%) Aderant
4 1 (0.66%) Google
4 1 (0.66%) iManage
4 1 (0.66%) SAP