Data Analysis Jobs with Hybrid/Remote/WFH Options

Data Analysis
UK > Work from Home

The table below provides summary statistics for permanent remote or hybrid work requiring Data Analysis skills. It includes a benchmarking guide to the annual salaries offered in vacancies that cited Data Analysis over the 6 months leading up to 1 May 2025, comparing them to the same period in the previous two years.

6 months to
1 May 2025
Same period 2024 Same period 2023
Rank 104 120 152
Rank change year-on-year +16 +32 -10
Permanent jobs citing Data Analysis 431 865 974
As % of all permanent jobs with a WFH option 2.88% 2.56% 2.28%
As % of the Processes & Methodologies category 3.09% 2.79% 2.37%
Number of salaries quoted 213 596 733
10th Percentile £29,370 £32,500 -
25th Percentile £40,988 £41,250 £30,500
Median annual salary (50th Percentile) £50,000 £52,500 £51,250
Median % change year-on-year -4.76% +2.44% -2.38%
75th Percentile £68,114 £71,250 £72,500
90th Percentile £79,500 £84,964 £84,750
UK median annual salary £55,000 £52,500 £52,500
% change year-on-year +4.76% - -2.78%

All Process and Methodology Skills
Work from Home

Data Analysis falls under the Processes and Methodologies category. For comparison with the information above, the following table provides summary statistics for all permanent job vacancies with remote or hybrid options requiring process or methodology skills.

Permanent vacancies with a requirement for process or methodology skills 13,930 31,014 41,082
As % of all permanent jobs with a WFH option 93.15% 91.65% 96.09%
Number of salaries quoted 9,709 23,583 28,561
10th Percentile £30,000 £33,930 £37,500
25th Percentile £45,000 £42,500 £47,500
Median annual salary (50th Percentile) £60,000 £57,500 £62,500
Median % change year-on-year +4.35% -8.00% +4.17%
75th Percentile £77,500 £75,000 £82,500
90th Percentile £102,500 £95,000 £100,000
UK median annual salary £57,500 £55,000 £61,500
% change year-on-year +4.55% -10.57% +2.50%

Data Analysis
Trend for Jobs with a WFH Option

Job vacancies with remote working options citing Data Analysis as a proportion of all IT jobs advertised.
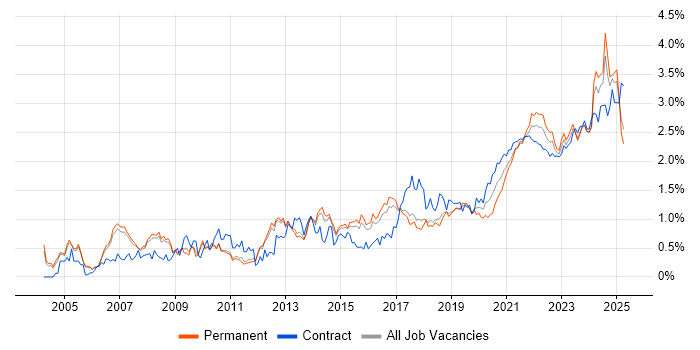
Data Analysis trend for jobs with Hybrid/Remote/WFH options

Data Analysis
Salary Trend for Jobs with a WFH Option

3-month moving average salary quoted in job vacancies with remote working options citing Data Analysis.

Data Analysis salary trend for jobs with a WFH option

Data Analysis
Salary Histogram for Jobs with a WFH Option

Salary distribution for jobs with remote working options citing Data Analysis over the 6 months to 1 May 2025.

Data Analysis salary histogram for jobs with a WFH option

Data Analysis
Co-occurring Skills and Capabilities with WFH Options by Category

The follow tables expand on the table above by listing co-occurrences grouped by category. The same employment type, locality and period is covered with up to 20 co-occurrences shown in each of the following categories:

Application Platforms
1 24 (5.57%) Jupyter
2 15 (3.48%) SharePoint
3 8 (1.86%) CMS
4 4 (0.93%) WordPress
5 3 (0.70%) Apache Airflow
5 3 (0.70%) ArcGIS
5 3 (0.70%) IBM Domino
6 2 (0.46%) Apache Spark
6 2 (0.46%) Drupal
6 2 (0.46%) Microsoft Exchange
7 1 (0.23%) Apache
7 1 (0.23%) Confluence
7 1 (0.23%) SAS
Applications
1 94 (21.81%) Microsoft Excel
2 18 (4.18%) Microsoft Office
3 13 (3.02%) Photoshop
4 8 (1.86%) Microsoft PowerPoint
5 7 (1.62%) Spreadsheet
6 6 (1.39%) Chatbot
7 3 (0.70%) MS Visio
8 2 (0.46%) Adobe Creative Suite
8 2 (0.46%) Adobe Illustrator
8 2 (0.46%) Adobe XD
8 2 (0.46%) Microsoft Project
8 2 (0.46%) Sketch
9 1 (0.23%) AutoCAD
9 1 (0.23%) Blender
9 1 (0.23%) Revit
9 1 (0.23%) Simulink
9 1 (0.23%) SPSS
9 1 (0.23%) Trello
Business Applications
1 8 (1.86%) Dynamics CRM
2 4 (0.93%) Maximo
3 3 (0.70%) Oracle EBS
3 3 (0.70%) Q-Pulse
4 2 (0.46%) Dynamics AX
5 1 (0.23%) Elite 3E
5 1 (0.23%) iTrent
5 1 (0.23%) Raiser’s Edge
5 1 (0.23%) SAP ERP
5 1 (0.23%) SAP S/4HANA
5 1 (0.23%) SystmOne
Cloud Services
1 147 (34.11%) Power Platform
2 57 (13.23%) Azure
3 36 (8.35%) AWS
4 28 (6.50%) GCP
4 28 (6.50%) Microsoft 365
5 19 (4.41%) Google Analytics
6 18 (4.18%) PowerApps
7 13 (3.02%) Azure DevOps
8 12 (2.78%) Adobe Analytics
8 12 (2.78%) Canva
9 10 (2.32%) GitHub
9 10 (2.32%) SaaS
9 10 (2.32%) Snowflake
10 8 (1.86%) Azure Synapse Analytics
10 8 (1.86%) GitHub Actions
10 8 (1.86%) Google Ads
10 8 (1.86%) Microsoft Advertising
11 7 (1.62%) Power Automate
12 6 (1.39%) Dynamics 365
12 6 (1.39%) Serverless
Communications & Networking
1 4 (0.93%) Intranet
2 3 (0.70%) Internet
3 1 (0.23%) 5G
3 1 (0.23%) Broadband
3 1 (0.23%) Ethernet
3 1 (0.23%) HTTP
3 1 (0.23%) Multicast
3 1 (0.23%) RS-232
3 1 (0.23%) SD-WAN
3 1 (0.23%) SMS
3 1 (0.23%) TCP/IP
3 1 (0.23%) WAN
3 1 (0.23%) Wi-Fi
Database & Business Intelligence
1 146 (33.87%) Power BI
2 53 (12.30%) Tableau
3 52 (12.06%) Big Data
4 31 (7.19%) Data Warehouse
5 28 (6.50%) SQL Server
6 20 (4.64%) Power Query
7 16 (3.71%) Relational Database
8 15 (3.48%) SQL Server Integration Services
8 15 (3.48%) SQL Server Reporting Services
9 14 (3.25%) Azure SQL Database
10 10 (2.32%) Data Lake
10 10 (2.32%) Data Mining
11 8 (1.86%) Looker
11 8 (1.86%) MySQL
12 7 (1.62%) GIS
12 7 (1.62%) Oracle Reports
13 6 (1.39%) BigQuery
13 6 (1.39%) Data Hub
13 6 (1.39%) Microsoft Analysis Services
14 5 (1.16%) NoSQL
Development Applications
1 9 (2.09%) JIRA
2 4 (0.93%) Git
3 1 (0.23%) GitLab
3 1 (0.23%) Katalon Studio
3 1 (0.23%) Selenium
3 1 (0.23%) SQL Server Management Studio (SSMS)
General
1 209 (48.49%) Finance
2 183 (42.46%) Social Skills
3 129 (29.93%) Analytical Skills
4 69 (16.01%) Inclusion and Diversity
5 43 (9.98%) Marketing
6 40 (9.28%) Banking
7 27 (6.26%) Presentation Skills
8 26 (6.03%) Retail
9 25 (5.80%) Law
9 25 (5.80%) Legal
10 16 (3.71%) Advertising
11 13 (3.02%) Manufacturing
12 12 (2.78%) Automotive
13 11 (2.55%) Public Sector
14 10 (2.32%) Organisational Skills
14 10 (2.32%) Telecoms
15 9 (2.09%) Billing
15 9 (2.09%) Influencing Skills
16 8 (1.86%) Police
16 8 (1.86%) Publishing
Job Titles
1 173 (40.14%) Analyst
2 85 (19.72%) Data Analyst
3 79 (18.33%) Senior
4 47 (10.90%) Data Scientist
5 39 (9.05%) Business Analyst
6 29 (6.73%) Senior Analyst
7 27 (6.26%) Financial Analyst
8 26 (6.03%) Procurement Analyst
9 23 (5.34%) Data Engineer
9 23 (5.34%) Senior Data Scientist
10 21 (4.87%) Lead
11 15 (3.48%) Administrator
11 15 (3.48%) Developer
12 12 (2.78%) Data Manager
13 10 (2.32%) Analytics Manager
13 10 (2.32%) Business Intelligence Analyst
13 10 (2.32%) DBA
13 10 (2.32%) Software Engineer
14 9 (2.09%) Commercial Analyst
14 9 (2.09%) Insight Analyst
Libraries, Frameworks & Software Standards
1 7 (1.62%) REST
2 5 (1.16%) NumPy
2 5 (1.16%) Pandas
2 5 (1.16%) SOAP
3 4 (0.93%) .NET
3 4 (0.93%) PySpark
3 4 (0.93%) Web Services
3 4 (0.93%) XML
4 3 (0.70%) Lightning Web Components
4 3 (0.70%) Oracle Fusion
4 3 (0.70%) PyTorch
4 3 (0.70%) scikit-learn
4 3 (0.70%) SQLAlchemy
4 3 (0.70%) TensorFlow
5 2 (0.46%) CSS
5 2 (0.46%) HTML
5 2 (0.46%) RabbitMQ
6 1 (0.23%) Entity Framework
6 1 (0.23%) Node.js
6 1 (0.23%) RESTful
Miscellaneous
1 65 (15.08%) Algorithms
1 65 (15.08%) Management Information System
2 46 (10.67%) Cyberattack
3 19 (4.41%) Social Media
4 16 (3.71%) Data Structures
4 16 (3.71%) Product Ownership
5 14 (3.25%) Self-Motivation
6 8 (1.86%) Credit Risk
6 8 (1.86%) NHS
7 6 (1.39%) Blog
7 6 (1.39%) Virtual Team
8 5 (1.16%) Analytical Mindset
9 4 (0.93%) IoT
10 3 (0.70%) Cloud Native
10 3 (0.70%) Distributed Computing
10 3 (0.70%) e-Learning
10 3 (0.70%) Life Science
10 3 (0.70%) Pricing Data
10 3 (0.70%) Reference Data
10 3 (0.70%) Tandem
Operating Systems
1 15 (3.48%) Windows
2 10 (2.32%) Linux
3 5 (1.16%) Ubuntu
3 5 (1.16%) Windows Vista
4 3 (0.70%) AIX
4 3 (0.70%) Solaris
4 3 (0.70%) Windows Server
5 2 (0.46%) Unix
Processes & Methodologies
1 182 (42.23%) Analytics
2 181 (42.00%) Visualisation
3 159 (36.89%) Problem-Solving
4 126 (29.23%) Business Intelligence
5 109 (25.29%) Decision-Making
6 83 (19.26%) Agile
7 82 (19.03%) Data Analytics
8 80 (18.56%) Computer Science
9 79 (18.33%) Statistics
10 75 (17.40%) Data Visualisation
11 72 (16.71%) Mathematics
12 68 (15.78%) Artificial Intelligence
12 68 (15.78%) Data Management
13 66 (15.31%) Actionable Insight
14 64 (14.85%) Data Science
15 63 (14.62%) Machine Learning
16 60 (13.92%) Continuous Improvement
17 58 (13.46%) Mentoring
18 57 (13.23%) Data-Driven Decision Making
19 51 (11.83%) Exploratory Data Analysis
Programming Languages
1 151 (35.03%) SQL
2 98 (22.74%) Python
3 29 (6.73%) JavaScript
4 28 (6.50%) Java
5 21 (4.87%) Data Analysis Expressions
6 19 (4.41%) C#
7 18 (4.18%) T-SQL
8 14 (3.25%) R
9 13 (3.02%) PowerShell
10 6 (1.39%) PL/SQL
11 4 (0.93%) MATLAB
11 4 (0.93%) VBA
12 2 (0.46%) C
12 2 (0.46%) C++
12 2 (0.46%) PHP
13 1 (0.23%) ABAP
13 1 (0.23%) Go
13 1 (0.23%) Julia
13 1 (0.23%) Perl
13 1 (0.23%) VB
Qualifications
1 163 (37.82%) Degree
2 59 (13.69%) Security Cleared
3 51 (11.83%) DV Cleared
4 35 (8.12%) DBS Check
5 32 (7.42%) Computer Science Degree
6 30 (6.96%) Master's Degree
7 26 (6.03%) Numerate Degree
8 11 (2.55%) PhD
9 9 (2.09%) SC Cleared
10 7 (1.62%) Azure Certification
11 6 (1.39%) CISSP
12 4 (0.93%) PMI Certification
13 3 (0.70%) CBAP
13 3 (0.70%) ITIL Certification
13 3 (0.70%) MBA
13 3 (0.70%) Microsoft Certification
13 3 (0.70%) PMP
14 2 (0.46%) ACCA
14 2 (0.46%) CIMA
14 2 (0.46%) CISM
Quality Assurance & Compliance
1 75 (17.40%) Data Quality
2 16 (3.71%) Accessibility
3 9 (2.09%) Actionable Recommendations
4 8 (1.86%) SLA
5 6 (1.39%) GDPR
6 4 (0.93%) COREP
6 4 (0.93%) ISO/IEC 27001
6 4 (0.93%) PMO
7 3 (0.70%) QA
8 2 (0.46%) NIST
9 1 (0.23%) WCAG
System Software
1 25 (5.80%) Docker
2 1 (0.23%) Embedded Firmware
2 1 (0.23%) Firmware
Systems Management
1 28 (6.50%) Kubernetes
2 7 (1.62%) Terraform
3 2 (0.46%) Ansible
Vendors
1 94 (21.81%) Microsoft
2 50 (11.60%) SAP
3 44 (10.21%) Google
4 19 (4.41%) Adobe
5 17 (3.94%) Salesforce
6 15 (3.48%) Databricks
7 11 (2.55%) Oracle
8 7 (1.62%) Omniture
9 6 (1.39%) PayPal
9 6 (1.39%) TikTok
10 5 (1.16%) IBM
10 5 (1.16%) ServiceNow
11 4 (0.93%) Workday
12 3 (0.70%) Concur
12 3 (0.70%) Informatica
12 3 (0.70%) Ping Identity
12 3 (0.70%) Red Hat
13 2 (0.46%) Cognos
13 2 (0.46%) JD Edwards
13 2 (0.46%) QAD