NoSQL Jobs with Hybrid/Remote/WFH Options

NoSQL
UK > Work from Home

The table below provides summary statistics for permanent remote or hybrid work requiring NoSQL skills. It includes a benchmarking guide to the annual salaries offered in vacancies that cited NoSQL over the 6 months leading up to 1 May 2025, comparing them to the same period in the previous two years.

6 months to
1 May 2025
Same period 2024 Same period 2023
Rank 190 261 128
Rank change year-on-year +71 -133 -28
Permanent jobs citing NoSQL 241 404 1,134
As % of all permanent jobs with a WFH option 1.61% 1.19% 2.65%
As % of the Database & Business Intelligence category 7.39% 5.22% 10.78%
Number of salaries quoted 173 353 580
10th Percentile £48,800 £45,000 £47,500
25th Percentile £53,764 £56,250 £56,250
Median annual salary (50th Percentile) £67,500 £65,465 £70,000
Median % change year-on-year +3.11% -6.48% -
75th Percentile £82,751 £83,750 £95,000
90th Percentile £97,250 £97,500 £117,236
UK median annual salary £70,000 £67,500 £73,000
% change year-on-year +3.70% -7.53% +4.29%

All Database and Business Intelligence Skills
Work from Home

NoSQL falls under the Databases and Business Intelligence category. For comparison with the information above, the following table provides summary statistics for all permanent job vacancies with remote or hybrid options requiring database or business intelligence skills.

Permanent vacancies with a requirement for database or business intelligence skills 3,263 7,737 10,523
As % of all permanent jobs with a WFH option 21.82% 22.86% 24.61%
Number of salaries quoted 2,407 6,233 7,238
10th Percentile £37,500 £37,199 £40,000
25th Percentile £50,000 £43,750 £49,750
Median annual salary (50th Percentile) £65,000 £57,500 £65,000
Median % change year-on-year +13.04% -11.54% +8.33%
75th Percentile £90,000 £75,000 £82,500
90th Percentile £122,500 £95,000 £102,500
UK median annual salary £62,500 £57,500 £65,000
% change year-on-year +8.70% -11.54% +8.33%

NoSQL
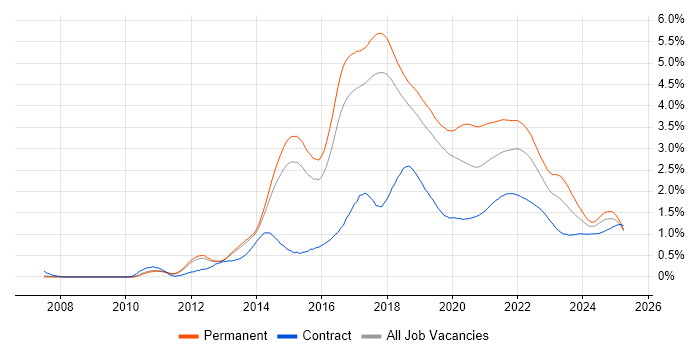
Trend for Jobs with a WFH Option

Job vacancies with remote working options citing NoSQL as a proportion of all IT jobs advertised.

NoSQL trend for jobs with Hybrid/Remote/WFH options

NoSQL
Salary Trend for Jobs with a WFH Option

3-month moving average salary quoted in job vacancies with remote working options citing NoSQL.

NoSQL salary trend for jobs with a WFH option

NoSQL
Salary Histogram for Jobs with a WFH Option

Salary distribution for jobs with remote working options citing NoSQL over the 6 months to 1 May 2025.

NoSQL salary histogram for jobs with a WFH option

NoSQL
Co-occurring Skills and Capabilities with WFH Options by Category

The follow tables expand on the table above by listing co-occurrences grouped by category. The same employment type, locality and period is covered with up to 20 co-occurrences shown in each of the following categories:

Application Platforms
1 16 (6.64%) Apache
1 16 (6.64%) Apache Spark
2 12 (4.98%) Apache Solr
2 12 (4.98%) nginx
3 9 (3.73%) Apache Airflow
4 7 (2.90%) SAS
5 5 (2.07%) Confluence
6 3 (1.24%) CMS
6 3 (1.24%) GemFire
6 3 (1.24%) OpenStack
7 2 (0.83%) Headless CMS
7 2 (0.83%) Tomcat
7 2 (0.83%) WebSphere
7 2 (0.83%) WebSphere Application Server
8 1 (0.41%) EPiServer
8 1 (0.41%) Mendix
8 1 (0.41%) Oracle SOA Suite
8 1 (0.41%) Umbraco
Applications
1 8 (3.32%) Microsoft Office
2 3 (1.24%) Chatbot
Cloud Services
1 113 (46.89%) AWS
2 101 (41.91%) Azure
3 85 (35.27%) GCP
4 42 (17.43%) SaaS
5 23 (9.54%) GitHub
6 17 (7.05%) Serverless
7 13 (5.39%) Apigee
7 13 (5.39%) Google Kubernetes Engine
8 11 (4.56%) Azure Cosmos DB
9 9 (3.73%) Amazon S3
9 9 (3.73%) AWS Lambda
9 9 (3.73%) OpenShift
10 8 (3.32%) Amazon EC2
10 8 (3.32%) GitHub Actions
11 7 (2.90%) AWS CloudFormation
12 6 (2.49%) Azure Functions
12 6 (2.49%) Azure Service Bus
13 5 (2.07%) Cloud Computing
14 4 (1.66%) Amazon ECS
14 4 (1.66%) Snowflake
Communications & Networking
1 13 (5.39%) DNS
2 12 (4.98%) HTTPS
2 12 (4.98%) IPsec
2 12 (4.98%) TCP/IP
3 5 (2.07%) HTTP
4 3 (1.24%) Firewall
5 2 (0.83%) Cisco Nexus
5 2 (0.83%) FCoE
5 2 (0.83%) Fibre Channel
5 2 (0.83%) Internet
5 2 (0.83%) iSCSI
5 2 (0.83%) LAN
5 2 (0.83%) Multicast
5 2 (0.83%) NAS
5 2 (0.83%) SAN
5 2 (0.83%) VPN
5 2 (0.83%) WAN
6 1 (0.41%) OpenVPN
6 1 (0.41%) SSH
Database & Business Intelligence
1 39 (16.18%) MongoDB
2 33 (13.69%) MySQL
3 26 (10.79%) PostgreSQL
4 23 (9.54%) Big Data
5 21 (8.71%) Data Warehouse
6 18 (7.47%) Relational Database
7 15 (6.22%) Couchbase
8 14 (5.81%) RDBMS
8 14 (5.81%) Redis
9 13 (5.39%) Hadoop
10 12 (4.98%) Elasticsearch
10 12 (4.98%) SQL Server
11 11 (4.56%) Data Lake
12 9 (3.73%) Apache Hudi
12 9 (3.73%) Apache Iceberg
12 9 (3.73%) Delta Lake
13 8 (3.32%) Amazon RDS
14 7 (2.90%) DynamoDB
15 4 (1.66%) Azure SQL Database
15 4 (1.66%) Neo4j
Development Applications
1 51 (21.16%) Git
2 37 (15.35%) JUnit
3 25 (10.37%) Jenkins
4 23 (9.54%) Maven
5 22 (9.13%) Eclipse
5 22 (9.13%) IntelliJ
5 22 (9.13%) Jasmine
5 22 (9.13%) Karma Test Runner
5 22 (9.13%) Mockito
5 22 (9.13%) Protractor
6 16 (6.64%) Sonatype Nexus
7 14 (5.81%) SonarQube
8 11 (4.56%) Bitbucket
9 10 (4.15%) JIRA
10 9 (3.73%) GitLab
11 8 (3.32%) Gradle
12 4 (1.66%) Storybook
12 4 (1.66%) TeamCity
12 4 (1.66%) webpack
13 3 (1.24%) Selenium
General
1 75 (31.12%) Finance
2 51 (21.16%) Banking
2 51 (21.16%) Social Skills
3 20 (8.30%) Law
4 13 (5.39%) Games
5 12 (4.98%) Analytical Skills
5 12 (4.98%) Inclusion and Diversity
6 11 (4.56%) Automotive
7 8 (3.32%) Front Office
7 8 (3.32%) Public Sector
8 7 (2.90%) Retail
9 6 (2.49%) Electronics
9 6 (2.49%) Legal
9 6 (2.49%) Tech for Good
10 5 (2.07%) Manufacturing
11 4 (1.66%) Marketing
12 3 (1.24%) Agriculture
12 3 (1.24%) Telecoms
13 2 (0.83%) Cantonese Language
13 2 (0.83%) Mandarin Language
Job Titles
1 81 (33.61%) Senior
2 74 (30.71%) Developer
3 51 (21.16%) Software Engineer
4 46 (19.09%) Architect
5 34 (14.11%) Solutions Architect
6 26 (10.79%) Lead
7 25 (10.37%) Java Developer
7 25 (10.37%) Senior Software Engineer
8 21 (8.71%) Senior Architect
9 20 (8.30%) Senior Developer
10 19 (7.88%) SaaS Developer
11 18 (7.47%) Backend Developer
12 16 (6.64%) Data Engineer
13 14 (5.81%) Senior DevOps
13 14 (5.81%) Software Developer
14 12 (4.98%) Senior Solutions Architect
15 11 (4.56%) Data Architect
15 11 (4.56%) DevOps Engineer
16 9 (3.73%) Full-Stack Developer
16 9 (3.73%) Senior Data Architect
Libraries, Frameworks & Software Standards
1 60 (24.90%) RabbitMQ
2 57 (23.65%) React
3 42 (17.43%) RESTful
4 41 (17.01%) Kafka
5 39 (16.18%) .NET
6 38 (15.77%) Hibernate
7 35 (14.52%) AngularJS
8 33 (13.69%) Spring
9 27 (11.20%) Spring Boot
10 25 (10.37%) REST
11 22 (9.13%) JPA
12 17 (7.05%) CSS
13 16 (6.64%) .NET Core
14 15 (6.22%) GraphQL
14 15 (6.22%) HTML
15 14 (5.81%) .NET Framework
16 13 (5.39%) Elastic Stack
16 13 (5.39%) Node.js
17 12 (4.98%) ASP.NET
18 11 (4.56%) Entity Framework
Miscellaneous
1 44 (18.26%) Algorithms
2 28 (11.62%) Cloud Native
3 26 (10.79%) Management Information System
4 23 (9.54%) Product Ownership
5 15 (6.22%) Distributed Systems
6 14 (5.81%) Data Structures
7 12 (4.98%) IoT
7 12 (4.98%) Legacy Systems
7 12 (4.98%) Mobile Games
8 8 (3.32%) Public Cloud
9 7 (2.90%) Credit Risk
9 7 (2.90%) Market Risk
9 7 (2.90%) Mobile App
10 6 (2.49%) Greenfield Project
10 6 (2.49%) Linux Command Line
11 5 (2.07%) Clustering
11 5 (2.07%) Legacy Code
12 4 (1.66%) Foreign Exchange (FX)
12 4 (1.66%) Robotics
13 3 (1.24%) Credit Derivative
Operating Systems
1 59 (24.48%) Linux
2 27 (11.20%) Unix
3 10 (4.15%) Apple iOS
3 10 (4.15%) Windows
4 7 (2.90%) Android
5 4 (1.66%) Robot Operating System
6 2 (0.83%) Solaris
6 2 (0.83%) Ubuntu
7 1 (0.41%) Debian
Processes & Methodologies
1 121 (50.21%) Microservices
2 105 (43.57%) CI/CD
3 100 (41.49%) Agile
4 77 (31.95%) DevOps
4 77 (31.95%) Software Engineering
5 63 (26.14%) Containerisation
6 52 (21.58%) Problem-Solving
7 46 (19.09%) Test Automation
8 40 (16.60%) Unit Testing
9 39 (16.18%) Computer Science
10 38 (15.77%) Analytics
10 38 (15.77%) ETL
11 37 (15.35%) Data Modelling
11 37 (15.35%) Mentoring
12 36 (14.94%) Continuous Improvement
13 35 (14.52%) Event-Driven
14 33 (13.69%) TDD
15 29 (12.03%) OO
16 27 (11.20%) Design Patterns
17 26 (10.79%) Data Science
Programming Languages
1 156 (64.73%) SQL
2 103 (42.74%) Java
3 91 (37.76%) Python
4 46 (19.09%) JavaScript
5 36 (14.94%) C#
6 19 (7.88%) TypeScript
7 18 (7.47%) Go
8 13 (5.39%) PHP
9 9 (3.73%) T-SQL
10 8 (3.32%) Bash
11 7 (2.90%) R
12 5 (2.07%) C++
12 5 (2.07%) Ruby
12 5 (2.07%) Scala
13 3 (1.24%) Bicep
13 3 (1.24%) PowerShell
14 2 (0.83%) PL/SQL
15 1 (0.41%) Lisp
15 1 (0.41%) MATLAB
15 1 (0.41%) Shell Script
Qualifications
1 42 (17.43%) Degree
2 25 (10.37%) Computer Science Degree
3 12 (4.98%) AWS Certification
3 12 (4.98%) AWS Certified Solutions Architect
4 9 (3.73%) Azure Certification
4 9 (3.73%) Master's Degree
5 2 (0.83%) DV Cleared
5 2 (0.83%) Microsoft Certification
5 2 (0.83%) Security Cleared
6 1 (0.41%) CISSP
6 1 (0.41%) ISTQB
6 1 (0.41%) ISTQB Foundation Certification
Quality Assurance & Compliance
1 22 (9.13%) Accessibility
2 17 (7.05%) GDPR
3 13 (5.39%) Data Quality
3 13 (5.39%) QA
4 8 (3.32%) HIPAA
5 7 (2.90%) Basel II
5 7 (2.90%) Basel III
5 7 (2.90%) Dodd-Frank
5 7 (2.90%) IFRS
5 7 (2.90%) IFRS 9
5 7 (2.90%) PCI DSS
6 6 (2.49%) NIST
7 1 (0.41%) GMP
System Software
1 89 (36.93%) Docker
2 10 (4.15%) HDFS
3 2 (0.83%) Active Directory
3 2 (0.83%) Hyper-V
3 2 (0.83%) KVM
3 2 (0.83%) NFS
3 2 (0.83%) SRDF
3 2 (0.83%) Veritas Cluster Server
3 2 (0.83%) VMware Infrastructure
3 2 (0.83%) Xen
Systems Management
1 82 (34.02%) Kubernetes
2 40 (16.60%) Terraform
3 14 (5.81%) Ansible
4 13 (5.39%) Istio
5 7 (2.90%) Prometheus
6 6 (2.49%) Argo
7 4 (1.66%) Grafana
8 3 (1.24%) Puppet
9 1 (0.41%) HP Quality Center
9 1 (0.41%) Marathon
Vendors
1 25 (10.37%) Google
2 22 (9.13%) IBM
3 17 (7.05%) Microsoft
4 10 (4.15%) Red Hat
5 7 (2.90%) New Relic
5 7 (2.90%) Oracle
6 6 (2.49%) Databricks
6 6 (2.49%) F5
7 3 (1.24%) Solace
7 3 (1.24%) TIBCO
8 2 (0.83%) Cisco
8 2 (0.83%) EMC
8 2 (0.83%) Informatica
8 2 (0.83%) NetApp
8 2 (0.83%) Revolut
8 2 (0.83%) Talend
8 2 (0.83%) VMware
9 1 (0.41%) Splunk
9 1 (0.41%) Workday
9 1 (0.41%) YouTube