Capacity Management Jobs with Work from Home Options

Capacity Management
UK > Work from Home

The table below provides summary statistics for permanent job vacancies with an option to work from home (WFH) and a requirement for Capacity Management skills. Included is a benchmarking guide to the salaries offered in vacancies that have cited Capacity Management over the 6 months to 24 April 2024 with a comparison to the same period in the previous 2 years.

6 months to
24 Apr 2024
Same period 2023 Same period 2022
Rank 510 624 638
Rank change year-on-year +114 +14 -138
Permanent jobs citing Capacity Management 66 56 197
As % of all permanent jobs with a WFH option 0.20% 0.13% 0.30%
As % of the Processes & Methodologies category 0.21% 0.13% 0.31%
Number of salaries quoted 48 38 157
10th Percentile £40,725 £44,750 £41,250
25th Percentile £47,500 £51,250 £48,750
Median annual salary (50th Percentile) £60,000 £60,000 £60,000
75th Percentile £70,625 £67,500 £75,000
90th Percentile £76,250 £76,250 £90,000
UK median annual salary £55,000 £60,000 £60,000
% change year-on-year -8.33% - +14.29%

All Process and Methodology Skills
Work from Home

Capacity Management is in the Processes and Methodologies category. The following table is for comparison with the above and provides summary statistics for all permanent job vacancies with a WFH option and a requirement for process or methodology skills.

Permanent vacancies with a requirement for process or methodology skills 31,001 41,929 64,513
As % of all permanent jobs with a WFH option 91.73% 96.07% 96.89%
Number of salaries quoted 23,603 28,952 41,201
10th Percentile £33,750 £37,500 £36,250
25th Percentile £42,500 £47,500 £45,000
Median annual salary (50th Percentile) £57,500 £62,500 £60,000
Median % change year-on-year -8.00% +4.17% +9.09%
75th Percentile £75,000 £82,500 £80,000
90th Percentile £95,000 £100,000 £95,000
UK median annual salary £55,000 £62,000 £60,000
% change year-on-year -11.29% +3.33% +9.09%

Capacity Management
Trend for Jobs with a WFH Option

Job vacancies with a work from home option citing Capacity Management as a proportion of all IT jobs advertised.
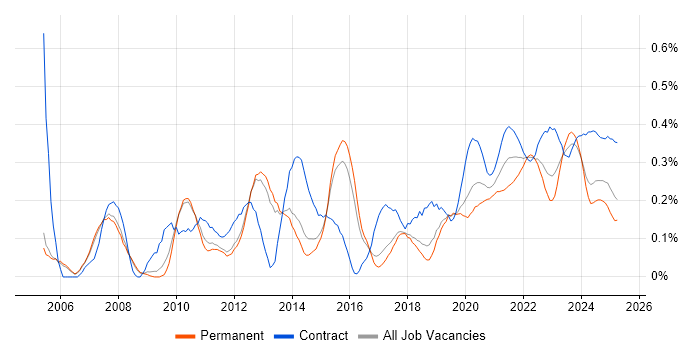
Capacity Management trend for jobs with a WFH option

Capacity Management
Salary Trend for Jobs with a WFH Option

3-month moving average salary quoted in job vacancies with a work from home option citing Capacity Management.

Capacity Management salary trend for jobs with a WFH option

Capacity Management
Salary Histogram for Jobs with a WFH Option

Salary distribution for jobs with a work from home option citing Capacity Management over the 6 months to 24 April 2024.

Capacity Management salary histogram for jobs with a WFH option

Capacity Management
Co-occurring Skills and Capabilities with WFH Options by Category

The follow tables expand on the table above by listing co-occurrences grouped by category. The same employment type, locality and period is covered with up to 20 co-occurrences shown in each of the following categories:

Application Platforms
1 16 (24.24%) Microsoft Exchange
2 3 (4.55%) NetWeaver
2 3 (4.55%) Oracle Service Bus
2 3 (4.55%) WebLogic
3 1 (1.52%) Apache
3 1 (1.52%) Confluence
3 1 (1.52%) nginx
3 1 (1.52%) Tomcat
Applications
1 3 (4.55%) Microsoft Excel
1 3 (4.55%) Microsoft Office
1 3 (4.55%) MS Visio
Business Applications
1 3 (4.55%) Remedy ITSM
1 3 (4.55%) SAP SD
Cloud Services
1 36 (54.55%) Azure
2 28 (42.42%) SaaS
3 18 (27.27%) AWS
4 11 (16.67%) GitHub
4 11 (16.67%) Serverless
5 10 (15.15%) Entra ID
6 9 (13.64%) Amazon EKS
6 9 (13.64%) AWS Lambda
6 9 (13.64%) Azure DevOps
6 9 (13.64%) GCP
6 9 (13.64%) GitHub Actions
7 6 (9.09%) Rubrik
8 2 (3.03%) Cloud Computing
8 2 (3.03%) IaaS
8 2 (3.03%) PaaS
9 1 (1.52%) Azure Stack
9 1 (1.52%) Microsoft 365
Communications & Networking
1 8 (12.12%) HTTPS
1 8 (12.12%) SAN
1 8 (12.12%) SSL
2 7 (10.61%) Network Security
3 6 (9.09%) DHCP
3 6 (9.09%) DNS
4 2 (3.03%) Firewall
4 2 (3.03%) Internet
4 2 (3.03%) VLAN
5 1 (1.52%) Broadband
5 1 (1.52%) HTTP
5 1 (1.52%) TCP/IP
5 1 (1.52%) VPLS
5 1 (1.52%) VPN
5 1 (1.52%) VSAT
Database & Business Intelligence
1 4 (6.06%) SQL Server
2 3 (4.55%) BusinessObjects
2 3 (4.55%) Oracle Database
2 3 (4.55%) Oracle Database 10g
2 3 (4.55%) Oracle Database 11g
2 3 (4.55%) SAP BW
2 3 (4.55%) VLDB
3 2 (3.03%) Data Warehouse
3 2 (3.03%) Elasticsearch
3 2 (3.03%) MySQL
4 1 (1.52%) Hazelcast
4 1 (1.52%) InfluxDB
4 1 (1.52%) MongoDB
Development Applications
1 12 (18.18%) Jenkins
2 9 (13.64%) CircleCI
2 9 (13.64%) Git
2 9 (13.64%) git-flow
2 9 (13.64%) GitLab
3 8 (12.12%) Vagrant
4 1 (1.52%) JIRA
General
1 17 (25.76%) Analytical Skills
2 15 (22.73%) Finance
3 13 (19.70%) Social Skills
4 10 (15.15%) Public Sector
5 9 (13.64%) Telecoms
6 1 (1.52%) Banking
6 1 (1.52%) Marketing
Job Titles
1 21 (31.82%) Infrastructure Engineer
2 13 (19.70%) Cloud Engineer
2 13 (19.70%) Senior
2 13 (19.70%) Senior Infrastructure Engineer
3 11 (16.67%) DevOps Engineer
3 11 (16.67%) Infrastructure Support
3 11 (16.67%) Infrastructure Support Engineer
3 11 (16.67%) Senior Infrastructure Support Engineer
3 11 (16.67%) Senior Support Engineer
3 11 (16.67%) Support Engineer
4 8 (12.12%) Administrator
4 8 (12.12%) Linux Administrator
4 8 (12.12%) Linux Systems Administrator
4 8 (12.12%) Systems Administrator
5 6 (9.09%) Analyst
6 5 (7.58%) Windows Engineer
6 5 (7.58%) Windows Infrastructure Engineer
7 4 (6.06%) Azure Engineer
8 3 (4.55%) CloudOps Engineer
8 3 (4.55%) Operations Engineer
Libraries, Frameworks & Software Standards
1 10 (15.15%) Elastic Stack
2 3 (4.55%) Node.js
2 3 (4.55%) SAP PI
3 2 (3.03%) Middleware
4 1 (1.52%) .NET
4 1 (1.52%) AngularJS
4 1 (1.52%) Apache Camel
4 1 (1.52%) ASP.NET
4 1 (1.52%) ASP.NET MVC
4 1 (1.52%) HTML
4 1 (1.52%) LAMP
4 1 (1.52%) LEMP Stack
4 1 (1.52%) REST
4 1 (1.52%) SOAP
4 1 (1.52%) Spring
4 1 (1.52%) XML
Miscellaneous
1 18 (27.27%) Management Information System
2 16 (24.24%) Self-Motivation
3 9 (13.64%) Onboarding
3 9 (13.64%) Virtual Team
4 3 (4.55%) Enterprise Software
5 2 (3.03%) CMDB
6 1 (1.52%) Cloud Native
6 1 (1.52%) Clustering
6 1 (1.52%) Data Centre
6 1 (1.52%) Hedge funds
6 1 (1.52%) Hybrid Cloud
6 1 (1.52%) Operational Technology
Operating Systems
1 27 (40.91%) Linux
2 23 (34.85%) Windows
3 18 (27.27%) Windows Server
4 13 (19.70%) Unix
5 10 (15.15%) Windows Server 2012
6 9 (13.64%) CentOS
6 9 (13.64%) Ubuntu
7 8 (12.12%) Red Hat Enterprise Linux
8 3 (4.55%) Solaris
Processes & Methodologies
1 25 (37.88%) Agile
2 21 (31.82%) Infrastructure Engineering
3 19 (28.79%) Problem-Solving
4 18 (27.27%) DevOps
5 17 (25.76%) Infrastructure as Code
5 17 (25.76%) ITIL
6 15 (22.73%) Collaborative Working
7 14 (21.21%) Availability Management
7 14 (21.21%) Service Design
8 13 (19.70%) Scrum
9 12 (18.18%) Continuous Integration
9 12 (18.18%) Information Security
10 11 (16.67%) CI/CD
10 11 (16.67%) Continuous Delivery
10 11 (16.67%) User Research
10 11 (16.67%) User Stories
11 10 (15.15%) Containerisation
11 10 (15.15%) DevSecOps
11 10 (15.15%) Service Delivery
12 9 (13.64%) Configuration Management
Programming Languages
1 17 (25.76%) Shell Script
2 7 (10.61%) Java
2 7 (10.61%) PowerShell
3 4 (6.06%) Python
4 3 (4.55%) ABAP
4 3 (4.55%) PL/SQL
4 3 (4.55%) SQL
5 2 (3.03%) Bash
6 1 (1.52%) C#
6 1 (1.52%) Go
6 1 (1.52%) JavaScript
Qualifications
1 15 (22.73%) Security Cleared
2 12 (18.18%) BPSS Clearance
2 12 (18.18%) SC Cleared
3 6 (9.09%) Degree
4 3 (4.55%) Cisco Certification
5 2 (3.03%) CCAA
5 2 (3.03%) CCNA
5 2 (3.03%) Citrix Certification
5 2 (3.03%) MCP
5 2 (3.03%) MCTS
5 2 (3.03%) Microsoft Certification
5 2 (3.03%) VMware Certified Professional (VCP)
6 1 (1.52%) CCDP
6 1 (1.52%) CCNP
6 1 (1.52%) CCSP
6 1 (1.52%) Computer Science Degree
6 1 (1.52%) ITIL Certification
6 1 (1.52%) ITIL Foundation Certificate
6 1 (1.52%) Master's Degree
Quality Assurance & Compliance
1 6 (9.09%) SLA
2 2 (3.03%) QA
System Software
1 27 (40.91%) Active Directory
2 21 (31.82%) Docker
3 17 (25.76%) VMware Infrastructure
4 10 (15.15%) VMware ESXi
5 6 (9.09%) DFS Replication
6 3 (4.55%) Oracle RAC
Systems Management
1 26 (39.39%) Ansible
2 18 (27.27%) Terraform
3 11 (16.67%) Kubernetes
4 10 (15.15%) vCenter Server
5 7 (10.61%) Puppet
6 6 (9.09%) Active Directory Federation Services
6 6 (9.09%) NetBackup
6 6 (9.09%) vRealize Orchestrator
7 3 (4.55%) Data Guard
7 3 (4.55%) Oracle RMAN
8 1 (1.52%) Cacti
8 1 (1.52%) Grafana
8 1 (1.52%) HAProxy
8 1 (1.52%) Icinga
8 1 (1.52%) Kibana
8 1 (1.52%) Progress Chef
8 1 (1.52%) Prometheus
Vendors
1 19 (28.79%) VMware
2 12 (18.18%) Microsoft
3 9 (13.64%) Citrix
3 9 (13.64%) Google
3 9 (13.64%) McAfee
4 6 (9.09%) Veeam
5 5 (7.58%) Remedy
6 4 (6.06%) Oracle
7 3 (4.55%) Cisco
7 3 (4.55%) SAP
7 3 (4.55%) Sun
8 2 (3.03%) HP
9 1 (1.52%) Sybase