Senior DevOps Engineer Jobs with Work from Home Options

Senior Development Operations Engineer
UK > Work from Home

The median Senior Development Operations Engineer salary in Work from Home is £72,500 per year according to job vacancies posted during the 6 months to 13 May 2024.

The first table below provides salary benchmarking and summary statistics including a comparison to same period in the previous 2 years.

6 months to
13 May 2024
Same period 2023 Same period 2022
Rank 470 400 400
Rank change year-on-year -70 0 -128
Permanent jobs requiring a Senior DevOps Engineer 107 285 581
As % of all permanent jobs with a WFH option 0.32% 0.69% 0.84%
As % of the Job Titles category 0.33% 0.72% 0.86%
Number of salaries quoted 99 259 299
10th Percentile £60,700 £67,700 £62,250
25th Percentile £62,500 £73,750 £67,500
Median annual salary (50th Percentile) £72,500 £85,000 £80,000
Median % change year-on-year -14.71% +6.25% +3.23%
75th Percentile £90,000 £95,000 £88,750
90th Percentile £105,000 £100,500 £95,000
UK median annual salary £79,125 £85,000 £82,500
% change year-on-year -6.91% +3.03% +3.13%

All Permanent IT Job Vacancies
Work from Home

The following table is for comparison with the above and includes summary statistics for all permanent IT job vacancies with a WFH option. Most job vacancies include a discernible job title that can be normalized. As such, the figures in the second row provide an indication of the number of permanent jobs in our overall sample.

Permanent vacancies in Work from Home with a recognized job title 32,351 39,695 67,533
% of permanent jobs with a recognized job title 95.97% 96.00% 97.37%
Number of salaries quoted 24,813 28,246 42,069
10th Percentile £33,036 £36,750 £36,250
25th Percentile £42,500 £47,447 £45,000
Median annual salary (50th Percentile) £56,318 £62,500 £60,000
Median % change year-on-year -9.89% +4.17% +9.09%
75th Percentile £75,000 £81,250 £80,000
90th Percentile £93,750 £100,000 £95,000
UK median annual salary £52,500 £60,000 £60,000
% change year-on-year -12.50% - +9.09%

Senior DevOps Engineer
Trend for Jobs with a WFH Option

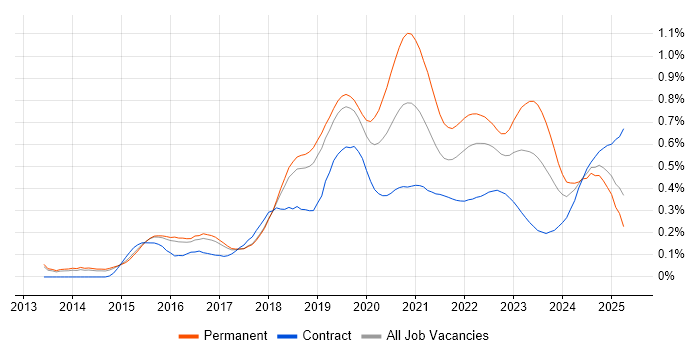
Job vacancies with a work from home option which featured Senior DevOps Engineer in the job title as a proportion of all IT jobs advertised.

Senior DevOps Engineer trend for jobs with a WFH option

Senior DevOps Engineer
Salary Trend for Jobs with a WFH Option

3-month moving average salary quoted in job vacancies with a work from home option citing Senior DevOps Engineer.

Senior DevOps Engineer salary trend for jobs with a WFH option

Senior DevOps Engineer
Salary Histogram for Jobs with a WFH Option

Salary distribution for jobs with a work from home option citing Senior DevOps Engineer over the 6 months to 13 May 2024.

Senior DevOps Engineer salary histogram for jobs with a WFH option

Senior DevOps Engineer Skill Set
Top 30 Co-occurring Skills and Capabilities in Job Vacancies with WFH Options

For the 6 months to 13 May 2024, Senior DevOps Engineer job roles required the following skills and capabilities in order of popularity. The figures indicate the absolute number co-occurrences and as a proportion of all permanent jobs with remote work options featuring Senior DevOps Engineer in the job title.

1 107 (100.00%) DevOps
2 66 (61.68%) Terraform
3 58 (54.21%) Infrastructure as Code
4 57 (53.27%) Azure
5 51 (47.66%) CI/CD
6 50 (46.73%) Python
7 48 (44.86%) AWS
8 46 (42.99%) Linux
8 46 (42.99%) Ansible
9 43 (40.19%) Kubernetes
10 38 (35.51%) Agile
10 38 (35.51%) Social Skills
11 37 (34.58%) GCP
12 36 (33.64%) Containerisation
13 34 (31.78%) Docker
13 34 (31.78%) Windows
14 32 (29.91%) SQL
14 32 (29.91%) Progress Chef
15 30 (28.04%) Jenkins
16 27 (25.23%) Puppet
17 24 (22.43%) Bash
17 24 (22.43%) Mentoring
17 24 (22.43%) Azure DevOps
18 22 (20.56%) Platform Engineering
19 21 (19.63%) Public Cloud
19 21 (19.63%) Software Delivery
19 21 (19.63%) ITIL
19 21 (19.63%) Banking
20 20 (18.69%) Migration
20 20 (18.69%) Finance

Senior DevOps Engineer Skill Set
Co-occurring Skills and Capabilities with WFH Options by Category

The follow tables expand on the table above by listing co-occurrences grouped by category. The same employment type, locality and period is covered with up to 20 co-occurrences shown in each of the following categories:

Application Platforms
1 3 (2.80%) Apache Airflow
2 2 (1.87%) Jupyter
3 1 (0.93%) Apache
3 1 (0.93%) Apache Spark
3 1 (0.93%) CMS
3 1 (0.93%) Drupal
3 1 (0.93%) nginx
3 1 (0.93%) WordPress
Cloud Services
1 57 (53.27%) Azure
2 48 (44.86%) AWS
3 37 (34.58%) GCP
4 24 (22.43%) Azure DevOps
5 18 (16.82%) Amazon S3
5 18 (16.82%) OpenShift
6 13 (12.15%) Serverless
7 10 (9.35%) GitHub
7 10 (9.35%) Power Platform
8 9 (8.41%) Azure Synapse Analytics
9 8 (7.48%) Amazon ECS
9 8 (7.48%) Azure Data Factory
9 8 (7.48%) Azure Data Lake Analytics
10 7 (6.54%) IaaS
10 7 (6.54%) PaaS
11 6 (5.61%) Amazon EKS
12 5 (4.67%) AWS CloudFormation
13 4 (3.74%) Amazon EC2
13 4 (3.74%) Entra ID
13 4 (3.74%) SaaS
Communications & Networking
1 14 (13.08%) Firewall
2 12 (11.21%) Internet
3 10 (9.35%) DNS
3 10 (9.35%) SNMP
3 10 (9.35%) TCP/IP
3 10 (9.35%) tcpdump
4 8 (7.48%) Network Security
5 4 (3.74%) IPv4
5 4 (3.74%) VPN
6 1 (0.93%) SD-WAN
6 1 (0.93%) VSAN
6 1 (0.93%) WAN
Database & Business Intelligence
1 11 (10.28%) Elasticsearch
1 11 (10.28%) MongoDB
1 11 (10.28%) MySQL
2 10 (9.35%) Power BI
3 9 (8.41%) Data Lake
4 8 (7.48%) Azure SQL Database
4 8 (7.48%) Data Warehouse
4 8 (7.48%) Microsoft Analysis Services
5 5 (4.67%) PostgreSQL
6 3 (2.80%) Amazon Aurora
6 3 (2.80%) Amazon RDS
7 1 (0.93%) Apache Cassandra
7 1 (0.93%) Apache Hive
7 1 (0.93%) Apache Pinot
7 1 (0.93%) Big Data
7 1 (0.93%) DynamoDB
7 1 (0.93%) Flink
7 1 (0.93%) Presto
Development Applications
1 30 (28.04%) Jenkins
2 17 (15.89%) IBM UrbanCode
3 8 (7.48%) Git
4 7 (6.54%) GitLab
5 2 (1.87%) CircleCI
5 2 (1.87%) Octopus Deploy
6 1 (0.93%) Atlassian Bamboo
6 1 (0.93%) JIRA
6 1 (0.93%) Team Foundation Server
6 1 (0.93%) TeamCity
6 1 (0.93%) Travis CI
6 1 (0.93%) Vagrant
General
1 38 (35.51%) Social Skills
2 21 (19.63%) Banking
3 20 (18.69%) Finance
4 17 (15.89%) Presentation Skills
5 12 (11.21%) Analytical Skills
6 10 (9.35%) Telecoms
7 8 (7.48%) Inclusion and Diversity
8 4 (3.74%) Aerospace
8 4 (3.74%) Public Sector
9 3 (2.80%) Advertising
9 3 (2.80%) Law
9 3 (2.80%) Manufacturing
10 2 (1.87%) Games
11 1 (0.93%) Fire and Rescue
11 1 (0.93%) Investment Banking
11 1 (0.93%) Retail
11 1 (0.93%) Tech for Good
Libraries, Frameworks & Software Standards
1 12 (11.21%) Elastic Stack
2 10 (9.35%) YAML
3 5 (4.67%) JSON
4 4 (3.74%) AWS CDK
4 4 (3.74%) RESTful
4 4 (3.74%) XML
5 3 (2.80%) REST
6 2 (1.87%) ADO
6 2 (1.87%) Kafka
6 2 (1.87%) Node.js
7 1 (0.93%) Next.js
7 1 (0.93%) Web Services
Miscellaneous
1 21 (19.63%) Public Cloud
2 10 (9.35%) Clustering
3 8 (7.48%) Enterprise Software
4 3 (2.80%) Management Information System
4 3 (2.80%) Renewable Energy
5 2 (1.87%) Client/Server
5 2 (1.87%) Cloud Native
5 2 (1.87%) Data Centre
6 1 (0.93%) Cyberattack
6 1 (0.93%) Distributed Systems
6 1 (0.93%) FMCG
6 1 (0.93%) Greenfield Project
6 1 (0.93%) Hedge funds
6 1 (0.93%) Product Ownership
6 1 (0.93%) Self-Motivation
6 1 (0.93%) Virtual Team
Operating Systems
1 46 (42.99%) Linux
2 34 (31.78%) Windows
3 2 (1.87%) Unix
4 1 (0.93%) Windows Server
Processes & Methodologies
1 107 (100.00%) DevOps
2 58 (54.21%) Infrastructure as Code
3 51 (47.66%) CI/CD
4 38 (35.51%) Agile
5 36 (33.64%) Containerisation
6 24 (22.43%) Mentoring
7 22 (20.56%) Platform Engineering
8 21 (19.63%) ITIL
8 21 (19.63%) Software Delivery
9 20 (18.69%) Migration
10 19 (17.76%) Problem Management
10 19 (17.76%) Problem-Solving
11 17 (15.89%) Customer Service
11 17 (15.89%) Service Management
11 17 (15.89%) Technical Leadership
12 14 (13.08%) High Availability
13 13 (12.15%) Continuous Deployment
14 12 (11.21%) Cybersecurity
14 12 (11.21%) Fintech
14 12 (11.21%) Performance Tuning
Programming Languages
1 50 (46.73%) Python
2 32 (29.91%) SQL
3 24 (22.43%) Bash
4 19 (17.76%) PowerShell
5 17 (15.89%) Groovy
6 14 (13.08%) Perl
7 8 (7.48%) Data Analysis Expressions
7 8 (7.48%) U-SQL
8 6 (5.61%) Java
9 5 (4.67%) PHP
9 5 (4.67%) Ruby
10 4 (3.74%) Go
10 4 (3.74%) Lua
10 4 (3.74%) Tcl
11 3 (2.80%) JavaScript
12 2 (1.87%) Shell Script
13 1 (0.93%) Bicep
13 1 (0.93%) C#
13 1 (0.93%) TypeScript
Qualifications
1 9 (8.41%) Degree
2 8 (7.48%) Microsoft Certification
3 6 (5.61%) Security Cleared
4 4 (3.74%) Computer Science Degree
4 4 (3.74%) DV Cleared
5 2 (1.87%) AWS Certification
5 2 (1.87%) AWS Certified DevOps Engineer
5 2 (1.87%) SC Cleared
6 1 (0.93%) AWS Certified Solutions Architect
Quality Assurance & Compliance
1 1 (0.93%) GDPR
1 1 (0.93%) ISO/IEC 27001
1 1 (0.93%) PCI DSS
System Software
1 34 (31.78%) Docker
2 14 (13.08%) VMware ESXi
3 4 (3.74%) Active Directory
3 4 (3.74%) VMware Infrastructure
4 3 (2.80%) KVM
5 1 (0.93%) Hyper-V
5 1 (0.93%) Virtual Servers
Systems Management
1 66 (61.68%) Terraform
2 46 (42.99%) Ansible
3 43 (40.19%) Kubernetes
4 32 (29.91%) Progress Chef
5 27 (25.23%) Puppet
6 13 (12.15%) Grafana
7 10 (9.35%) Graphite
7 10 (9.35%) HAProxy
7 10 (9.35%) Nagios
7 10 (9.35%) vCenter Server
8 4 (3.74%) Argo
8 4 (3.74%) vRealize
9 3 (2.80%) Prometheus
10 2 (1.87%) Packer
11 1 (0.93%) Consul
11 1 (0.93%) Kibana
11 1 (0.93%) Podman
11 1 (0.93%) Salt
Vendors
1 19 (17.76%) Google
2 17 (15.89%) IBM
2 17 (15.89%) Microsoft
3 9 (8.41%) VMware
4 8 (7.48%) Databricks
5 4 (3.74%) Cisco
5 4 (3.74%) SaltStack
5 4 (3.74%) ServiceNow
6 2 (1.87%) Remedy
6 2 (1.87%) Splunk
7 1 (0.93%) CrowdStrike
7 1 (0.93%) F5
7 1 (0.93%) New Relic
7 1 (0.93%) xMatters