Hybrid/Remote Kubernetes Job Trends

Kubernetes (k8s)
UK > Work from Home

The table below provides summary statistics and salary benchmarking for remote or hybrid work requiring Kubernetes skills. It covers permanent job vacancies from the 6 months leading up to 22 November 2025, with comparisons to the same periods in the previous two years.

6 months to
22 Nov 2025
Same period 2024 Same period 2023
Rank 84 43 33
Rank change year-on-year -41 -10 -6
Permanent jobs citing Kubernetes 473 1,153 1,575
As % of all permanent jobs with remote/hybrid work options 3.09% 5.72% 7.34%
As % of the Systems Management category 36.19% 46.08% 45.72%
Number of salaries quoted 373 589 1,330
10th Percentile £51,250 £51,659 £48,750
25th Percentile £58,750 £60,000 £60,000
Median annual salary (50th Percentile) £75,000 £75,000 £72,500
Median % change year-on-year - +3.45% -3.33%
75th Percentile £87,500 £93,750 £88,438
90th Percentile £113,500 £112,500 £105,000
UK median annual salary £75,000 £77,500 £75,000
% change year-on-year -3.23% +3.33% -3.23%

All Systems Management Skills
Work from Home

Kubernetes falls under the Systems Management category. For comparison with the information above, the following table provides summary statistics for all permanent job vacancies with remote or hybrid options requiring systems management skills.

Permanent vacancies with a requirement for systems management skills 1,307 2,502 3,445
As % of all permanent jobs with a WFH option 8.55% 12.40% 16.05%
Number of salaries quoted 979 1,469 2,966
10th Percentile £36,700 £40,000 £41,250
25th Percentile £48,458 £50,500 £51,250
Median annual salary (50th Percentile) £65,000 £67,500 £67,500
Median % change year-on-year -3.70% - -2.80%
75th Percentile £83,125 £85,000 £85,000
90th Percentile £100,000 £100,000 £97,500
UK median annual salary £60,500 £67,500 £65,000
% change year-on-year -10.37% +3.85% -3.70%

Kubernetes
Job Vacancy Trend for Remote/Hybrid Jobs

Historical trend showing the proportion of permanent IT job postings citing Kubernetes and offering remote or hybrid work options relative to all permanent IT jobs advertised.
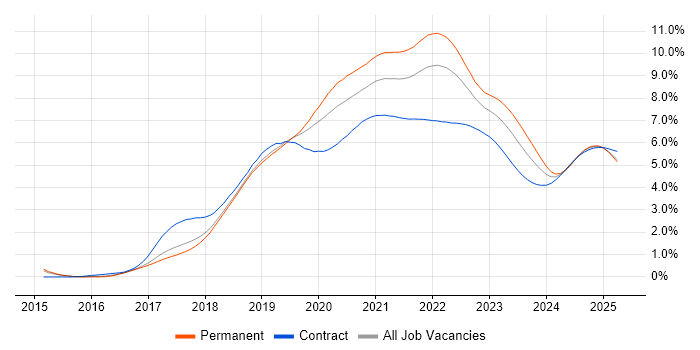
Kubernetes job vacancy trend for remote/hybrid jobs

Kubernetes
Salary Trend for Remote/Hybrid Jobs

Salary distribution trend for jobs with remote/hybrid work options citing Kubernetes.

Salary distribution trend for jobs with remote/hybrid work options citing Kubernetes

Kubernetes
Salary Histogram for Remote/Hybrid Jobs

Salary distribution for jobs with remote/hybrid work options citing Kubernetes over the 6 months to 22 November 2025.

Kubernetes salary histogram for jobs with remote/hybrid work options

Kubernetes
Co-Occurring Skills & Capabilities in Remote/Hybrid Jobs by Category

The following tables expand on the one above by listing co-occurrences grouped by category. They cover the same employment type, locality and period, with up to 20 co-occurrences shown in each category:

Application Platforms
1 12 (2.54%) IIS
2 11 (2.33%) Apache Spark
3 10 (2.11%) Apache Airflow
4 6 (1.27%) Apache
4 6 (1.27%) nginx
5 5 (1.06%) Anypoint
6 4 (0.85%) Apache Pulsar
6 4 (0.85%) Confluence
6 4 (0.85%) Microsoft Exchange
7 2 (0.42%) ArcGIS
7 2 (0.42%) GeoServer
7 2 (0.42%) Oracle Spatial
8 1 (0.21%) Apache Solr
8 1 (0.21%) BizTalk Server
8 1 (0.21%) OpenStack
8 1 (0.21%) SharePoint
8 1 (0.21%) Tomcat
Business Applications
1 5 (1.06%) Shopify
Cloud Services
1 285 (60.25%) AWS
2 259 (54.76%) Azure
3 124 (26.22%) GCP
4 115 (24.31%) GitHub
5 74 (15.64%) GitHub Actions
6 73 (15.43%) Azure DevOps
7 54 (11.42%) Amazon EKS
8 52 (10.99%) SaaS
9 46 (9.73%) Azure AKS
10 45 (9.51%) Serverless
11 43 (9.09%) AWS CloudFormation
12 41 (8.67%) Amazon CloudWatch
13 33 (6.98%) AWS Lambda
14 31 (6.55%) Amazon ECS
15 29 (6.13%) OpenShift
16 23 (4.86%) Amazon S3
17 20 (4.23%) Azure Monitor
17 20 (4.23%) Datadog
18 16 (3.38%) Azure Cosmos DB
19 14 (2.96%) Entra ID
Communications & Networking
1 37 (7.82%) Firewall
2 16 (3.38%) DNS
3 15 (3.17%) VPN
4 11 (2.33%) TCP/IP
4 11 (2.33%) WAN
5 9 (1.90%) LAN
6 8 (1.69%) Network Security
7 6 (1.27%) Fibre Channel
8 5 (1.06%) Broadband
8 5 (1.06%) DHCP
8 5 (1.06%) Internet
9 4 (0.85%) Intrusion Detection
9 4 (0.85%) SD-WAN
10 3 (0.63%) Kerberos
11 2 (0.42%) AMQP
11 2 (0.42%) VLAN
11 2 (0.42%) VSAN
12 1 (0.21%) 5G
12 1 (0.21%) MIMO
12 1 (0.21%) NAS
Database & Business Intelligence
1 61 (12.90%) PostgreSQL
2 52 (10.99%) NoSQL
3 41 (8.67%) SQL Server
4 39 (8.25%) MongoDB
5 18 (3.81%) Relational Database
6 17 (3.59%) MySQL
7 12 (2.54%) Amazon RDS
8 11 (2.33%) Elasticsearch
8 11 (2.33%) Redis
9 10 (2.11%) DynamoDB
10 7 (1.48%) Azure SQL Database
11 6 (1.27%) Big Data
12 5 (1.06%) BigQuery
12 5 (1.06%) Data Warehouse
12 5 (1.06%) Flink
12 5 (1.06%) Power BI
13 4 (0.85%) Data Lake
14 3 (0.63%) Amazon Athena
14 3 (0.63%) Apache Ignite
14 3 (0.63%) Pinecone
Development Applications
1 70 (14.80%) Git
2 59 (12.47%) Jenkins
3 48 (10.15%) GitLab
4 20 (4.23%) TeamCity
5 9 (1.90%) JUnit
6 8 (1.69%) Cucumber
6 8 (1.69%) Selenium
7 7 (1.48%) SonarQube
8 6 (1.27%) JIRA
8 6 (1.27%) Sonatype Nexus
8 6 (1.27%) Visual Studio Code
9 5 (1.06%) Octopus Deploy
10 4 (0.85%) Robot Framework
11 3 (0.63%) Bitbucket
12 2 (0.42%) Artifactory
12 2 (0.42%) CircleCI
12 2 (0.42%) Eclipse
12 2 (0.42%) git-flow
12 2 (0.42%) JMeter
12 2 (0.42%) TestRail
General
1 92 (19.45%) Social Skills
2 84 (17.76%) Finance
3 37 (7.82%) Law
4 33 (6.98%) Banking
4 33 (6.98%) Public Sector
5 31 (6.55%) Financial Institution
6 30 (6.34%) Retail
7 24 (5.07%) Inclusion and Diversity
8 22 (4.65%) Back Office
8 22 (4.65%) Telecoms
9 10 (2.11%) Front Office
10 9 (1.90%) Analytical Skills
11 7 (1.48%) Legal
12 6 (1.27%) Documentation Skills
12 6 (1.27%) Games
13 5 (1.06%) Automotive
13 5 (1.06%) Marketing
13 5 (1.06%) Tech for Good
14 4 (0.85%) Manufacturing
15 3 (0.63%) Electronics
Job Titles
1 138 (29.18%) Senior
2 89 (18.82%) DevOps Engineer
3 69 (14.59%) Software Engineer
4 68 (14.38%) Developer
5 54 (11.42%) Cloud Engineer
5 54 (11.42%) Lead
6 39 (8.25%) Infrastructure Engineer
7 37 (7.82%) Architect
8 34 (7.19%) Azure Engineer
8 34 (7.19%) Platform Engineer
9 27 (5.71%) Senior DevOps
10 26 (5.50%) Senior Software Engineer
11 24 (5.07%) Python Engineer
11 24 (5.07%) Senior Developer
12 20 (4.23%) Senior DevOps Engineer
13 19 (4.02%) Solutions Architect
14 18 (3.81%) AWS DevOps
14 18 (3.81%) AWS Engineer
14 18 (3.81%) Software Developer
15 16 (3.38%) Senior Cloud Engineer
Libraries, Frameworks & Software Standards
1 74 (15.64%) .NET
2 54 (11.42%) React
3 51 (10.78%) Spring
4 50 (10.57%) Spring Boot
5 48 (10.15%) Kafka
6 46 (9.73%) RESTful
7 34 (7.19%) REST
8 30 (6.34%) Elastic Stack
9 29 (6.13%) Node.js
10 25 (5.29%) RabbitMQ
11 24 (5.07%) Django
12 23 (4.86%) Flask
13 21 (4.44%) .NET Core
14 20 (4.23%) gRPC
15 19 (4.02%) AngularJS
16 17 (3.59%) FastAPI
16 17 (3.59%) Web Services
17 16 (3.38%) YAML
18 15 (3.17%) .NET Framework
19 12 (2.54%) GraphQL
Miscellaneous
1 153 (32.35%) Cloud Native
2 43 (9.09%) Distributed Systems
3 30 (6.34%) Onboarding
4 23 (4.86%) Product Ownership
5 20 (4.23%) Data Centre
6 19 (4.02%) Management Information System
7 16 (3.38%) Hybrid Cloud
7 16 (3.38%) Public Cloud
8 15 (3.17%) Legacy Systems
9 10 (2.11%) Self-Motivation
10 8 (1.69%) Algorithms
11 7 (1.48%) Greenfield Project
11 7 (1.48%) Private Cloud
11 7 (1.48%) Security Posture
12 6 (1.27%) Virtual Team
13 5 (1.06%) AI Agents
13 5 (1.06%) Derivative
13 5 (1.06%) Fixed Income
13 5 (1.06%) Linux Command Line
13 5 (1.06%) Low-Code
Operating Systems
1 118 (24.95%) Linux
2 72 (15.22%) Windows
3 26 (5.50%) Windows Server
4 20 (4.23%) Unix
5 13 (2.75%) Red Hat Enterprise Linux
6 10 (2.11%) Android
6 10 (2.11%) Windows Server 2019
7 9 (1.90%) Ubuntu
8 8 (1.69%) Rocky
8 8 (1.69%) VMS
9 6 (1.27%) CentOS
10 4 (0.85%) Apple iOS
11 3 (0.63%) Debian
Processes & Methodologies
1 296 (62.58%) DevOps
2 292 (61.73%) CI/CD
3 195 (41.23%) Containerisation
4 165 (34.88%) Infrastructure as Code
5 135 (28.54%) Microservices
6 126 (26.64%) Agile
7 111 (23.47%) Software Engineering
8 101 (21.35%) Problem-Solving
9 87 (18.39%) Infrastructure Engineering
10 79 (16.70%) Continuous Improvement
11 74 (15.64%) AI
12 73 (15.43%) Mentoring
13 69 (14.59%) Observability
14 58 (12.26%) Platform Engineering
15 56 (11.84%) Site Reliability Engineering
16 49 (10.36%) Cloud Security
17 48 (10.15%) Machine Learning
18 46 (9.73%) High Availability
18 46 (9.73%) Test Automation
19 44 (9.30%) Coaching
Programming Languages
1 207 (43.76%) Python
2 108 (22.83%) Java
3 98 (20.72%) SQL
4 71 (15.01%) PowerShell
5 66 (13.95%) C#
6 65 (13.74%) Bash
7 57 (12.05%) JavaScript
8 42 (8.88%) Bicep
9 37 (7.82%) Go
9 37 (7.82%) TypeScript
10 8 (1.69%) Delphi
11 7 (1.48%) PHP
11 7 (1.48%) Scala
12 6 (1.27%) C++
12 6 (1.27%) Shell Script
13 5 (1.06%) Kotlin
14 4 (0.85%) F#
14 4 (0.85%) OCaml
14 4 (0.85%) Ruby
14 4 (0.85%) T-SQL
Qualifications
1 74 (15.64%) Security Cleared
2 57 (12.05%) SC Cleared
3 51 (10.78%) Degree
4 49 (10.36%) AWS Certification
5 39 (8.25%) Azure Certification
6 30 (6.34%) Computer Science Degree
7 22 (4.65%) DV Cleared
8 15 (3.17%) AWS Certified Solutions Architect
9 10 (2.11%) BPSS Clearance
10 8 (1.69%) Network+ Certification
11 7 (1.48%) Master's Degree
12 6 (1.27%) PhD
13 5 (1.06%) Cisco Certification
13 5 (1.06%) CISM
13 5 (1.06%) CISSP
14 4 (0.85%) AWS Certified Cloud Practitioner
15 3 (0.63%) (ISC)2 CCSP
15 3 (0.63%) CompTIA Security+
16 2 (0.42%) AWS Certified Developer
16 2 (0.42%) AWS Certified DevOps Engineer
Quality Assurance & Compliance
1 25 (5.29%) QA
2 24 (5.07%) GDPR
3 16 (3.38%) ISO/IEC 27001
4 12 (2.54%) NIST
5 11 (2.33%) HIPAA
5 11 (2.33%) PCI DSS
5 11 (2.33%) SOC 2
6 6 (1.27%) Data Quality
7 5 (1.06%) SLA
8 4 (0.85%) GRC
9 2 (0.42%) ECSS
10 1 (0.21%) MiFID
System Software
1 284 (60.04%) Docker
2 26 (5.50%) Active Directory
3 16 (3.38%) Hyper-V
4 15 (3.17%) VMware Infrastructure
5 11 (2.33%) vSphere
6 6 (1.27%) NFS
7 5 (1.06%) Virtual Machines
8 3 (0.63%) VMware NSX
9 2 (0.42%) Virtual Servers
10 1 (0.21%) Dovecot
10 1 (0.21%) Postfix
10 1 (0.21%) vCloud
10 1 (0.21%) VMware ESXi
Systems Management
1 209 (44.19%) Terraform
2 99 (20.93%) Ansible
3 95 (20.08%) Grafana
4 54 (11.42%) Prometheus
5 20 (4.23%) Argo
6 5 (1.06%) Cilium
7 4 (0.85%) Progress Chef
7 4 (0.85%) Puppet
8 3 (0.63%) Microsoft Data Protection Manager
8 3 (0.63%) SCCM
8 3 (0.63%) SCOM
8 3 (0.63%) WSUS
9 2 (0.42%) Kubeflow
9 2 (0.42%) Kustomize
9 2 (0.42%) Microsoft Intune
10 1 (0.21%) FortiGate
10 1 (0.21%) ITRS Geneos
10 1 (0.21%) Kibana
10 1 (0.21%) logstash
10 1 (0.21%) Oracle Enterprise Manager
Vendors
1 49 (10.36%) Microsoft
2 25 (5.29%) Google
3 24 (5.07%) Oracle
4 21 (4.44%) Red Hat
4 21 (4.44%) VMware
5 17 (3.59%) Dell
6 13 (2.75%) Splunk
7 11 (2.33%) Cisco
8 8 (1.69%) SAP
9 7 (1.48%) Commvault
9 7 (1.48%) Pure Storage
10 6 (1.27%) Databricks
11 5 (1.06%) Dynatrace
11 5 (1.06%) Epicor
11 5 (1.06%) IFS
11 5 (1.06%) Informatica
11 5 (1.06%) Jitterbit
11 5 (1.06%) MuleSoft
11 5 (1.06%) SnapLogic
11 5 (1.06%) Workday