TCP/IP Jobs with Hybrid/Remote/WFH Options

Transmission Control Protocol/Internet Protocol (TCP/IP)
UK > Work from Home

The table below provides summary statistics for permanent remote or hybrid work requiring TCP/IP skills. It includes a benchmarking guide to the annual salaries offered in vacancies that cited TCP/IP over the 6 months leading up to 1 May 2025, comparing them to the same period in the previous two years.

6 months to
1 May 2025
Same period 2024 Same period 2023
Rank 218 203 229
Rank change year-on-year -15 +26 +92
Permanent jobs citing TCP/IP 196 539 636
As % of all permanent jobs with a WFH option 1.31% 1.59% 1.49%
As % of the Communications & Networking category 7.80% 10.18% 13.27%
Number of salaries quoted 154 410 458
10th Percentile £31,250 £31,250 £27,750
25th Percentile £40,875 £38,038 £35,750
Median annual salary (50th Percentile) £55,000 £52,500 £50,000
Median % change year-on-year +4.76% +5.00% +5.26%
75th Percentile £72,281 £68,563 £67,500
90th Percentile £84,625 £80,000 £81,000
UK median annual salary £47,500 £42,500 £45,000
% change year-on-year +11.76% -5.56% -

All Communications and Computer Networking Skills
Work from Home

TCP/IP falls under the Communications and Computer Networking category. For comparison with the information above, the following table provides summary statistics for all permanent job vacancies with remote or hybrid options requiring communications or computer networking skills.

Permanent vacancies with a requirement for communications or computer networking skills 2,513 5,294 4,791
As % of all permanent jobs with a WFH option 16.80% 15.65% 11.21%
Number of salaries quoted 1,608 3,435 3,553
10th Percentile £23,504 £31,250 £31,300
25th Percentile £25,087 £40,000 £41,250
Median annual salary (50th Percentile) £40,000 £52,500 £57,500
Median % change year-on-year -23.81% -8.70% +1.77%
75th Percentile £62,500 £67,500 £76,250
90th Percentile £78,750 £80,000 £88,750
UK median annual salary £47,500 £47,875 £50,250
% change year-on-year -0.78% -4.73% -4.29%

TCP/IP
Trend for Jobs with a WFH Option

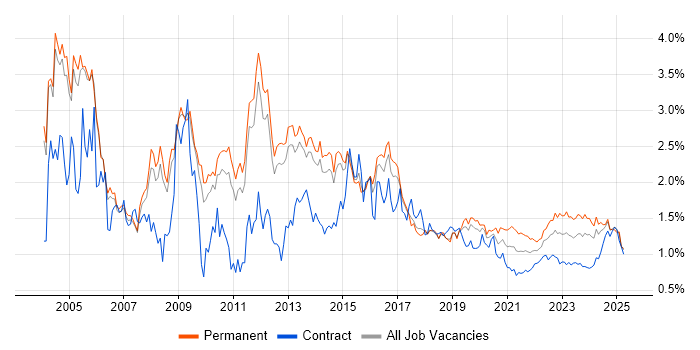
Job vacancies with remote working options citing TCP/IP as a proportion of all IT jobs advertised.

TCP/IP trend for jobs with Hybrid/Remote/WFH options

TCP/IP
Salary Trend for Jobs with a WFH Option

3-month moving average salary quoted in job vacancies with remote working options citing TCP/IP.

TCP/IP salary trend for jobs with a WFH option

TCP/IP
Salary Histogram for Jobs with a WFH Option

Salary distribution for jobs with remote working options citing TCP/IP over the 6 months to 1 May 2025.

TCP/IP salary histogram for jobs with a WFH option

TCP/IP
Co-occurring Skills and Capabilities with WFH Options by Category

The follow tables expand on the table above by listing co-occurrences grouped by category. The same employment type, locality and period is covered with up to 20 co-occurrences shown in each of the following categories:

Application Platforms
1 22 (11.22%) Microsoft Exchange
2 12 (6.12%) Apache Solr
2 12 (6.12%) nginx
3 9 (4.59%) IIS
3 9 (4.59%) SharePoint
4 5 (2.55%) Apache
5 2 (1.02%) Skype for Business
Applications
1 19 (9.69%) Microsoft Office
2 3 (1.53%) Microsoft Excel
2 3 (1.53%) Microsoft PowerPoint
Cloud Services
1 60 (30.61%) Azure
2 48 (24.49%) AWS
3 39 (19.90%) Microsoft 365
4 22 (11.22%) Cloud Computing
5 19 (9.69%) GCP
6 15 (7.65%) AWS CloudFormation
7 14 (7.14%) SaaS
8 11 (5.61%) Amazon ECR
8 11 (5.61%) Amazon ECS
8 11 (5.61%) Amazon ElastiCache
8 11 (5.61%) Amazon OpenSearch
8 11 (5.61%) AWS CodeBuild
8 11 (5.61%) dbt
8 11 (5.61%) Pulumi
9 10 (5.10%) Entra ID
10 9 (4.59%) Sentry
11 7 (3.57%) IaaS
11 7 (3.57%) PaaS
12 5 (2.55%) Google Workspace
12 5 (2.55%) OneDrive
Communications & Networking
1 81 (41.33%) DNS
2 63 (32.14%) Firewall
3 62 (31.63%) DHCP
4 36 (18.37%) WAN
5 34 (17.35%) VPN
6 33 (16.84%) LAN
7 26 (13.27%) VLAN
8 20 (10.20%) IPsec
9 17 (8.67%) Network Security
9 17 (8.67%) Wireless
10 16 (8.16%) Wi-Fi
11 14 (7.14%) BGP
12 12 (6.12%) HTTPS
12 12 (6.12%) OSPF
13 11 (5.61%) HTTP
13 11 (5.61%) VoIP
14 10 (5.10%) Internet
15 9 (4.59%) Modbus
16 7 (3.57%) SD-WAN
17 6 (3.06%) SSL
Database & Business Intelligence
1 15 (7.65%) SQL Server
2 12 (6.12%) Couchbase
2 12 (6.12%) MySQL
2 12 (6.12%) NoSQL
3 11 (5.61%) Amazon RDS
3 11 (5.61%) Elasticsearch
3 11 (5.61%) PostgreSQL
3 11 (5.61%) Redis
4 5 (2.55%) Relational Database
5 1 (0.51%) Metadata
5 1 (0.51%) SQLite
Development Applications
1 8 (4.08%) Git
2 5 (2.55%) Jenkins
3 4 (2.04%) JIRA
3 4 (2.04%) Spinnaker
3 4 (2.04%) Subversion
4 2 (1.02%) JMeter
General
1 64 (32.65%) Finance
2 56 (28.57%) Social Skills
3 23 (11.73%) Analytical Skills
3 23 (11.73%) Banking
4 19 (9.69%) Inclusion and Diversity
5 15 (7.65%) Investment Banking
6 9 (4.59%) Public Sector
7 7 (3.57%) Local Government
8 6 (3.06%) Back Office
8 6 (3.06%) Presentation Skills
8 6 (3.06%) Retail
9 5 (2.55%) Law
10 4 (2.04%) Influencing Skills
10 4 (2.04%) Organisational Skills
10 4 (2.04%) Police
11 2 (1.02%) Aerospace
11 2 (1.02%) Health Technology
11 2 (1.02%) Marketing
11 2 (1.02%) Multimedia
12 1 (0.51%) Automotive
Job Titles
1 56 (28.57%) Senior
2 28 (14.29%) Developer
3 27 (13.78%) Network Engineer
4 21 (10.71%) C++ Developer
5 20 (10.20%) Linux Developer
5 20 (10.20%) Low Latency C++ Developer
6 17 (8.67%) Analyst
7 14 (7.14%) Investment Banking C++ Developer
7 14 (7.14%) Linux Scripter
8 13 (6.63%) Embedded Engineer
8 13 (6.63%) Embedded Firmware Engineer
8 13 (6.63%) Firmware Engineer
8 13 (6.63%) Infrastructure Engineer
8 13 (6.63%) Lead
8 13 (6.63%) Senior Embedded Engineer
8 13 (6.63%) Senior Firmware Engineer
8 13 (6.63%) Support Engineer
9 12 (6.12%) IT Support
10 10 (5.10%) DevOps Engineer
10 10 (5.10%) Site Reliability Engineer
Libraries, Frameworks & Software Standards
1 15 (7.65%) RabbitMQ
2 11 (5.61%) Django
3 8 (4.08%) HTML
4 5 (2.55%) JSON
4 5 (2.55%) XML
5 4 (2.04%) SOAP
5 4 (2.04%) XSLT
5 4 (2.04%) YAML
6 3 (1.53%) .NET
6 3 (1.53%) .NET Core
6 3 (1.53%) .NET Framework
6 3 (1.53%) Entity Framework
6 3 (1.53%) Kafka
6 3 (1.53%) REST
7 2 (1.02%) 802.1X
7 2 (1.02%) ARM Templates
7 2 (1.02%) Elastic Stack
8 1 (0.51%) LEMP Stack
8 1 (0.51%) React
8 1 (0.51%) WSH
Miscellaneous
1 25 (12.76%) FPGA
2 21 (10.71%) Data Centre
3 20 (10.20%) Management Information System
4 14 (7.14%) Self-Motivation
5 10 (5.10%) Clustering
6 9 (4.59%) Device Driver
6 9 (4.59%) Distributed Systems
6 9 (4.59%) Product Ownership
7 6 (3.06%) Client/Server
8 5 (2.55%) Algorithms
8 5 (2.55%) Onboarding
8 5 (2.55%) Security Posture
9 4 (2.04%) Cloud Security Posture
9 4 (2.04%) Driving Licence
9 4 (2.04%) GNSS
9 4 (2.04%) MicroBlaze
9 4 (2.04%) Replication
9 4 (2.04%) Security Operations Centre
9 4 (2.04%) Self-Driving Car
9 4 (2.04%) Tandem
Operating Systems
1 83 (42.35%) Windows
2 79 (40.31%) Linux
3 44 (22.45%) Windows Server
4 27 (13.78%) Unix
5 10 (5.10%) Windows Server 2019
6 9 (4.59%) Embedded Linux
7 8 (4.08%) Windows 10
7 8 (4.08%) Windows Server 2016
8 7 (3.57%) Red Hat Enterprise Linux
9 5 (2.55%) Mac OS
9 5 (2.55%) Windows Server 2008
9 5 (2.55%) Windows Server 2012
10 3 (1.53%) Windows 7
11 2 (1.02%) Android
11 2 (1.02%) Apple iOS
11 2 (1.02%) Debian
11 2 (1.02%) Mac OS X
11 2 (1.02%) SUSE
11 2 (1.02%) Windows Server 2003
11 2 (1.02%) zOS
Processes & Methodologies
1 66 (33.67%) Problem-Solving
2 41 (20.92%) CI/CD
3 40 (20.41%) DevOps
4 28 (14.29%) Cybersecurity
4 28 (14.29%) Disaster Recovery
5 27 (13.78%) ITIL
6 24 (12.24%) Low Latency
7 22 (11.22%) Continuous Improvement
8 21 (10.71%) Agile
8 21 (10.71%) Continuous Integration
9 20 (10.20%) Site Reliability Engineering
10 18 (9.18%) Customer Service
10 18 (9.18%) Infrastructure Engineering
11 17 (8.67%) Change Management
11 17 (8.67%) Collaborative Working
12 15 (7.65%) Clean Code
12 15 (7.65%) Multithreading
12 15 (7.65%) Open Source
13 14 (7.14%) Performance Monitoring
14 13 (6.63%) Observability
Programming Languages
1 41 (20.92%) C
1 41 (20.92%) Python
2 38 (19.39%) C++
3 26 (13.27%) PowerShell
4 19 (9.69%) Java
5 18 (9.18%) SQL
6 13 (6.63%) PHP
7 11 (5.61%) Bash
8 8 (4.08%) JavaScript
8 8 (4.08%) Perl
9 7 (3.57%) Shell Script
10 6 (3.06%) TypeScript
11 5 (2.55%) C#
12 4 (2.04%) Jython
13 2 (1.02%) Bicep
13 2 (1.02%) JCL
14 1 (0.51%) VBA
14 1 (0.51%) VBScript
Qualifications
1 31 (15.82%) Security Cleared
2 23 (11.73%) SC Cleared
3 22 (11.22%) Degree
4 19 (9.69%) Cisco Certification
5 14 (7.14%) CCNA
6 10 (5.10%) CCNP
7 5 (2.55%) CISSP
7 5 (2.55%) Computer Science Degree
7 5 (2.55%) Microsoft Certification
8 4 (2.04%) AWS Certification
8 4 (2.04%) Azure Certification
8 4 (2.04%) CompTIA Security+
8 4 (2.04%) DV Cleared
8 4 (2.04%) GCIA
8 4 (2.04%) ITIL Certification
8 4 (2.04%) Network+ Certification
8 4 (2.04%) SANS
9 2 (1.02%) JNCIA
10 1 (0.51%) CEH
10 1 (0.51%) MCITP
Quality Assurance & Compliance
1 16 (8.16%) SLA
2 9 (4.59%) ISO/IEC 27001
3 4 (2.04%) Cyber Essentials
3 4 (2.04%) QA
3 4 (2.04%) Sarbanes-Oxley
4 2 (1.02%) GDPR
4 2 (1.02%) NIST
5 1 (0.51%) ISO 13485
5 1 (0.51%) ISO 9001
System Software
1 34 (17.35%) Active Directory
1 34 (17.35%) VMware Infrastructure
2 26 (13.27%) Hyper-V
3 19 (9.69%) Docker
4 18 (9.18%) Firmware
5 13 (6.63%) Embedded Firmware
6 5 (2.55%) Veritas Cluster Server
6 5 (2.55%) VMware ESXi
7 4 (2.04%) Virtual Machines
8 2 (1.02%) vSphere
9 1 (0.51%) BitLocker
Systems Management
1 27 (13.78%) Ansible
2 25 (12.76%) Terraform
3 17 (8.67%) Kubernetes
4 11 (5.61%) AWS Copilot
5 6 (3.06%) Microsoft Intune
6 5 (2.55%) SCCM
6 5 (2.55%) ZABBIX
7 4 (2.04%) SCOM
8 3 (1.53%) Active Directory Federation Services
8 3 (1.53%) Progress Chef
8 3 (1.53%) Puppet
9 2 (1.02%) Dell DRAC
9 2 (1.02%) Iperf
9 2 (1.02%) SCOrch
9 2 (1.02%) SCSM
9 2 (1.02%) Tivoli NetView
10 1 (0.51%) Failover Clustering
10 1 (0.51%) FortiGate
10 1 (0.51%) Single Sign-On
Vendors
1 63 (32.14%) Microsoft
2 50 (25.51%) VMware
3 17 (8.67%) Cisco
4 16 (8.16%) Google
5 8 (4.08%) Oracle
5 8 (4.08%) Red Hat
6 6 (3.06%) Dell
6 6 (3.06%) SolarWinds
7 5 (2.55%) Juniper
7 5 (2.55%) Veritas
8 4 (2.04%) Dynatrace
8 4 (2.04%) HP
8 4 (2.04%) IBM
8 4 (2.04%) ServiceNow
8 4 (2.04%) Symantec
9 3 (1.53%) EMC
9 3 (1.53%) TOWER Software
10 2 (1.02%) Avaya
10 2 (1.02%) CheckPoint
10 2 (1.02%) Salesforce