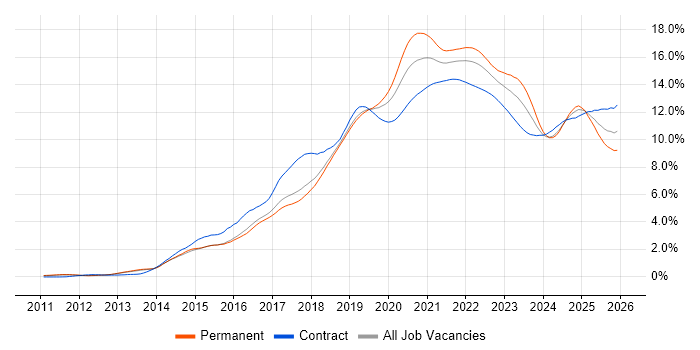
Hybrid/Remote DevOps Job Trends

DevOps
UK > Work from Home

The table below provides summary statistics and salary benchmarking for remote or hybrid work requiring DevOps skills. It covers vacancies from the 6 months leading up to 15 September 2025, with comparisons to the same periods in the previous two years.

6 months to
15 Sep 2025
Same period 2024 Same period 2023
Rank 17 19 10
Rank change year-on-year +2 -9 +1
Permanent jobs citing DevOps 1,710 2,268 3,819
As % of all permanent jobs with a WFH option 10.57% 9.78% 15.16%
As % of the Processes & Methodologies category 11.34% 11.16% 15.90%
Number of salaries quoted 925 1,604 3,179
10th Percentile £46,344 £42,500 £46,250
25th Percentile £56,250 £53,750 £55,000
Median annual salary (50th Percentile) £70,000 £67,500 £69,447
Median % change year-on-year +3.70% -2.80% -0.79%
75th Percentile £83,750 £85,000 £87,419
90th Percentile £100,000 £105,000 £105,000
UK median annual salary £70,000 £67,500 £70,000
% change year-on-year +3.70% -3.57% -

All Process and Methodology Skills
Work from Home

DevOps falls under the Processes and Methodologies category. For comparison with the information above, the following table provides summary statistics for all permanent job vacancies with remote or hybrid options requiring process or methodology skills.

Permanent vacancies with a requirement for process or methodology skills 15,073 20,325 24,017
As % of all permanent jobs with a WFH option 93.13% 87.67% 95.37%
Number of salaries quoted 8,550 12,689 19,809
10th Percentile £29,913 £35,500 £37,500
25th Percentile £40,512 £45,000 £47,500
Median annual salary (50th Percentile) £60,000 £60,000 £62,500
Median % change year-on-year - -4.00% +2.16%
75th Percentile £78,750 £80,000 £81,250
90th Percentile £100,000 £100,000 £100,000
UK median annual salary £55,000 £57,500 £60,000
% change year-on-year -4.35% -4.17% -

DevOps
Trend for Jobs with a WFH Option

Job vacancies with remote working options citing DevOps as a proportion of all IT jobs advertised.

DevOps trend for jobs with Hybrid/Remote/WFH options

DevOps
Salary Trend for Jobs with Hybrid Work Options

Salary distribution trend for jobs with remote work options citing DevOps.

Salary distribution trend for jobs with remote work options citing DevOps

DevOps
Salary Histogram for Jobs with a WFH Option

Salary distribution for jobs with remote working options citing DevOps over the 6 months to 15 September 2025.

DevOps salary histogram for jobs with a WFH option

DevOps
Co-occurring Skills and Capabilities with WFH Options by Category

The follow tables expand on the table above by listing co-occurrences grouped by category. The same employment type, locality and period is covered with up to 20 co-occurrences shown in each of the following categories:

Application Platforms
1 189 (11.05%) Confluence
2 26 (1.52%) SharePoint
3 12 (0.70%) Apache
3 12 (0.70%) Apache Spark
4 11 (0.64%) CMS
4 11 (0.64%) nginx
5 10 (0.58%) IIS
6 9 (0.53%) Microsoft Exchange
7 8 (0.47%) Apache Airflow
8 6 (0.35%) Oracle SOA Suite
9 2 (0.12%) Adobe Experience Manager
9 2 (0.12%) BizTalk Server
9 2 (0.12%) Drupal
10 1 (0.058%) Apache Solr
10 1 (0.058%) ArcGIS
10 1 (0.058%) ColdFusion
10 1 (0.058%) Headless CMS
10 1 (0.058%) MetaMask
10 1 (0.058%) Tomcat
10 1 (0.058%) WordPress
Applications
1 25 (1.46%) Microsoft Excel
2 8 (0.47%) Microsoft Office
3 5 (0.29%) Microsoft Project
4 4 (0.23%) MS Visio
5 2 (0.12%) Spreadsheet
6 1 (0.058%) Chatbot
6 1 (0.058%) PlantUML
6 1 (0.058%) Trello
Business Applications
1 25 (1.46%) Dynamics CRM
2 12 (0.70%) Dynamics NAV
2 12 (0.70%) Oracle ERP
3 8 (0.47%) Shopify
4 2 (0.12%) Infor M3
5 1 (0.058%) Aladdin
5 1 (0.058%) Magento
5 1 (0.058%) Salesforce CRM
5 1 (0.058%) SAP S/4HANA
5 1 (0.058%) Sparx Enterprise Architect
Cloud Services
1 1,038 (60.70%) Azure
2 671 (39.24%) AWS
3 432 (25.26%) Azure DevOps
4 306 (17.89%) GCP
5 178 (10.41%) GitHub
6 152 (8.89%) Power Platform
7 129 (7.54%) SaaS
8 88 (5.15%) GitHub Actions
9 85 (4.97%) Serverless
10 80 (4.68%) Dynamics 365
11 66 (3.86%) PaaS
11 66 (3.86%) Power Automate
12 64 (3.74%) Microsoft 365
13 63 (3.68%) Azure Monitor
13 63 (3.68%) Entra ID
14 59 (3.45%) Azure Service Bus
15 48 (2.81%) AWS Lambda
16 47 (2.75%) AWS CloudFormation
17 41 (2.40%) Azure Data Factory
18 37 (2.16%) IaaS
Communications & Networking
1 316 (18.48%) VPN
2 262 (15.32%) Cisco IOS
3 57 (3.33%) Firewall
4 45 (2.63%) DNS
5 43 (2.51%) WAN
6 26 (1.52%) SD-WAN
7 24 (1.40%) LAN
8 22 (1.29%) Network Security
9 17 (0.99%) TCP/IP
10 15 (0.88%) DHCP
11 11 (0.64%) VoIP
11 11 (0.64%) Wi-Fi
12 9 (0.53%) SAN
12 9 (0.53%) VLAN
13 8 (0.47%) Broadband
14 6 (0.35%) BGP
14 6 (0.35%) Fibre Channel
14 6 (0.35%) Unified Communications
15 5 (0.29%) DMZ
15 5 (0.29%) Internet
Database & Business Intelligence
1 373 (21.81%) SQL Server
2 91 (5.32%) Power BI
3 58 (3.39%) Data Warehouse
4 55 (3.22%) NoSQL
5 38 (2.22%) MySQL
5 38 (2.22%) PostgreSQL
6 34 (1.99%) Relational Database
6 34 (1.99%) Tableau
7 33 (1.93%) Data Lake
8 29 (1.70%) Azure SQL Database
9 25 (1.46%) Elasticsearch
9 25 (1.46%) MongoDB
10 21 (1.23%) Amazon RDS
11 16 (0.94%) Amazon Redshift
11 16 (0.94%) SQL Server Integration Services
12 15 (0.88%) BigQuery
13 14 (0.82%) DynamoDB
14 12 (0.70%) Azure SQL Data Warehouse
15 10 (0.58%) Big Data
15 10 (0.58%) Metadata
Development Applications
1 333 (19.47%) JIRA
2 308 (18.01%) GitLab
3 281 (16.43%) SonarQube
4 269 (15.73%) Sonatype Nexus
5 268 (15.67%) Selenium
6 264 (15.44%) Maven
7 254 (14.85%) Cucumber
8 250 (14.62%) Bitbucket
9 176 (10.29%) Git
10 97 (5.67%) Jenkins
11 30 (1.75%) Visual Studio
12 22 (1.29%) JUnit
12 22 (1.29%) Octopus Deploy
13 19 (1.11%) Team Foundation Server
14 16 (0.94%) Cypress.io
15 15 (0.88%) MSBuild
16 14 (0.82%) Postman
17 12 (0.70%) Oracle Forms
17 12 (0.70%) TeamCity
18 10 (0.58%) Mockito
General
1 594 (34.74%) Inclusion and Diversity
2 563 (32.92%) Finance
3 365 (21.35%) Analytical Skills
4 309 (18.07%) Social Skills
5 296 (17.31%) Banking
6 161 (9.42%) Retail
7 95 (5.56%) Investment Banking
8 90 (5.26%) Corporate Banking
9 74 (4.33%) Law
10 58 (3.39%) Public Sector
11 55 (3.22%) Marketing
12 28 (1.64%) Back Office
13 26 (1.52%) Documentation Skills
14 22 (1.29%) Presentation Skills
14 22 (1.29%) Telecoms
15 17 (0.99%) Legal
16 16 (0.94%) Games
17 13 (0.76%) Front Office
18 11 (0.64%) Pharmaceutical
19 8 (0.47%) Automotive
Job Titles
1 351 (20.53%) Software Engineer
2 304 (17.78%) Infrastructure Engineer
3 260 (15.20%) Senior
4 224 (13.10%) Developer
5 157 (9.18%) DevOps Engineer
6 138 (8.07%) Lead
7 129 (7.54%) Architect
8 84 (4.91%) Cloud Engineer
9 69 (4.04%) Senior Developer
10 61 (3.57%) Azure Engineer
11 56 (3.27%) Analyst
11 56 (3.27%) Senior DevOps
12 53 (3.10%) .NET Developer
13 50 (2.92%) Data Engineer
14 47 (2.75%) AWS DevOps
15 42 (2.46%) Senior Software Engineer
16 40 (2.34%) Platform Engineer
17 39 (2.28%) AWS Engineer
17 39 (2.28%) Solutions Architect
18 37 (2.16%) Senior DevOps Engineer
Libraries, Frameworks & Software Standards
1 397 (23.22%) React
2 318 (18.60%) HTML
3 314 (18.36%) CSS
4 306 (17.89%) Spring
5 291 (17.02%) Spring Boot
6 283 (16.55%) Elastic Stack
7 281 (16.43%) Kafka
8 250 (14.62%) Redux
9 248 (14.50%) .NET
9 248 (14.50%) JPA
10 186 (10.88%) REST
11 170 (9.94%) Hibernate
12 167 (9.77%) RESTful
13 107 (6.26%) Jest
14 97 (5.67%) CSS3
14 97 (5.67%) HTML5
15 94 (5.50%) Sass
16 71 (4.15%) .NET Framework
17 53 (3.10%) .NET Core
18 52 (3.04%) Node.js
Miscellaneous
1 321 (18.77%) Product Ownership
2 276 (16.14%) Enterprise Software
3 264 (15.44%) Cyberattack
4 167 (9.77%) Cloud Native
5 72 (4.21%) Management Information System
6 42 (2.46%) Data Centre
7 33 (1.93%) Onboarding
8 32 (1.87%) NHS
9 30 (1.75%) Analytical Mindset
9 30 (1.75%) Distributed Systems
10 21 (1.23%) Public Cloud
10 21 (1.23%) Self-Motivation
11 16 (0.94%) Hybrid Cloud
12 15 (0.88%) IoT
12 15 (0.88%) Legacy Systems
12 15 (0.88%) Mobile App
12 15 (0.88%) Security Posture
13 13 (0.76%) Operational Technology
14 11 (0.64%) Data Structures
14 11 (0.64%) Low-Code
Operating Systems
1 415 (24.27%) Linux
2 368 (21.52%) Windows
3 266 (15.56%) Android
4 35 (2.05%) Windows Server
5 30 (1.75%) Unix
6 18 (1.05%) Red Hat Enterprise Linux
7 15 (0.88%) Windows Server 2019
8 13 (0.76%) Windows Server 2012
9 11 (0.64%) Debian
10 9 (0.53%) Ubuntu
11 8 (0.47%) VMS
12 7 (0.41%) Windows Server 2016
13 6 (0.35%) CentOS
14 5 (0.29%) Windows Server 2008
15 4 (0.23%) Apple iOS
16 3 (0.18%) Windows 10
17 1 (0.058%) Amazon Linux
17 1 (0.058%) Mac OS
Processes & Methodologies
1 859 (50.23%) CI/CD
2 788 (46.08%) Agile
3 526 (30.76%) Problem-Solving
4 472 (27.60%) Microservices
5 447 (26.14%) Software Engineering
6 438 (25.61%) Containerisation
7 414 (24.21%) Test Automation
8 350 (20.47%) SDLC
9 343 (20.06%) Continuous Improvement
10 341 (19.94%) Platform Engineering
11 340 (19.88%) Infrastructure Engineering
12 333 (19.47%) Full-Stack Development
13 307 (17.95%) Mentoring
14 306 (17.89%) Performance Optimisation
15 302 (17.66%) Risk Management
16 299 (17.49%) Infrastructure as Code
17 295 (17.25%) Front End Development
18 284 (16.61%) Task Automation
19 283 (16.55%) Line Management
20 273 (15.96%) Mathematics
Programming Languages
1 630 (36.84%) Python
2 565 (33.04%) SQL
3 423 (24.74%) JavaScript
4 417 (24.39%) Java
5 405 (23.68%) PowerShell
6 376 (21.99%) Bash
7 268 (15.67%) C#
8 194 (11.35%) TypeScript
9 53 (3.10%) Bicep
10 47 (2.75%) Go
11 23 (1.35%) C
12 21 (1.23%) PL/SQL
13 19 (1.11%) C++
13 19 (1.11%) T-SQL
14 18 (1.05%) PHP
14 18 (1.05%) R
15 17 (0.99%) Perl
16 15 (0.88%) Scala
16 15 (0.88%) Shell Script
17 12 (0.70%) X++
Qualifications
1 163 (9.53%) Degree
2 107 (6.26%) Security Cleared
3 93 (5.44%) Computer Science Degree
4 89 (5.20%) Azure Certification
4 89 (5.20%) SC Cleared
5 64 (3.74%) AWS Certification
6 35 (2.05%) Microsoft Certification
7 34 (1.99%) Master's Degree
8 29 (1.70%) AWS Certified Solutions Architect
9 21 (1.23%) Cisco Certification
10 18 (1.05%) DBS Check
10 18 (1.05%) ISTQB
11 15 (0.88%) CCNP
11 15 (0.88%) CISSP
12 14 (0.82%) PMP
13 13 (0.76%) DV Cleared
13 13 (0.76%) PMI Certification
14 12 (0.70%) TOGAF Certification
15 8 (0.47%) AWS Certified DevOps Engineer
16 7 (0.41%) CISM
Quality Assurance & Compliance
1 374 (21.87%) QA
2 110 (6.43%) Accessibility
3 79 (4.62%) GDPR
4 66 (3.86%) ISO/IEC 27001
5 40 (2.34%) NIST
6 31 (1.81%) Data Quality
7 25 (1.46%) HIPAA
8 20 (1.17%) Sarbanes-Oxley
9 17 (0.99%) ISO 9001
10 11 (0.64%) PMO
11 10 (0.58%) Cyber Essentials
11 10 (0.58%) NCSC
12 7 (0.41%) SOC 2
13 6 (0.35%) PCI DSS
13 6 (0.35%) SLA
14 4 (0.23%) WCAG
15 3 (0.18%) CDISC
15 3 (0.18%) Cyber Essentials PLUS
15 3 (0.18%) Software Quality Assurance
16 2 (0.12%) NIST 800
System Software
1 783 (45.79%) Docker
2 278 (16.26%) vSphere
3 267 (15.61%) Hyper-V
4 262 (15.32%) VMware NSX
5 51 (2.98%) Active Directory
6 42 (2.46%) Virtual Machines
7 28 (1.64%) VMware Infrastructure
8 11 (0.64%) VMware ESXi
9 9 (0.53%) Virtual Desktop
10 7 (0.41%) NFS
11 5 (0.29%) HDFS
11 5 (0.29%) Kamailio
12 3 (0.18%) Virtual Servers
13 2 (0.12%) Firmware
14 1 (0.058%) Dovecot
14 1 (0.058%) Postfix
Systems Management
1 573 (33.51%) Terraform
2 547 (31.99%) Kubernetes
3 395 (23.10%) Ansible
4 67 (3.92%) Grafana
5 62 (3.63%) Prometheus
6 31 (1.81%) Single Sign-On
7 18 (1.05%) Microsoft Intune
8 15 (0.88%) Istio
9 14 (0.82%) Red Hat Satellite
10 11 (0.64%) Argo
11 10 (0.58%) SCCM
12 7 (0.41%) vCenter Server
13 6 (0.35%) Nagios
13 6 (0.35%) Puppet
14 4 (0.23%) Progress Chef
15 3 (0.18%) Jamf Pro
15 3 (0.18%) Kibana
16 2 (0.12%) Kubeflow
16 2 (0.12%) Kustomize
16 2 (0.12%) SCOM
Vendors
1 305 (17.84%) Microsoft
2 286 (16.73%) Cisco
3 270 (15.79%) Splunk
4 269 (15.73%) 3PAR
5 262 (15.32%) Juniper
6 247 (14.44%) Solace
7 62 (3.63%) Databricks
8 49 (2.87%) Oracle
9 45 (2.63%) Google
10 44 (2.57%) VMware
11 40 (2.34%) Red Hat
12 28 (1.64%) Salesforce
13 20 (1.17%) Meraki
14 18 (1.05%) SolarWinds
15 11 (0.64%) SAP
16 10 (0.58%) Dynatrace
16 10 (0.58%) ServiceNow
17 9 (0.53%) Commvault
17 9 (0.53%) IBM
17 9 (0.53%) OpenAI