Hybrid/Remote SCOM Job Trends

Microsoft System Center Operations Manager (SCOM)
UK > Work from Home

The table below provides summary statistics and salary benchmarking for remote or hybrid work requiring SCOM skills. It covers vacancies from the 6 months leading up to 13 September 2025, with comparisons to the same periods in the previous two years.

6 months to
13 Sep 2025
Same period 2024 Same period 2023
Rank 403 448 459
Rank change year-on-year +45 +11 +311
Permanent jobs citing SCOM 14 44 66
As % of all permanent jobs with a WFH option 0.086% 0.19% 0.26%
As % of the Systems Management category 0.75% 1.68% 1.62%
Number of salaries quoted 10 14 62
10th Percentile £61,000 £44,250 £42,445
25th Percentile £62,500 £52,000 £52,556
Median annual salary (50th Percentile) £65,000 £56,525 £56,525
Median % change year-on-year +14.99% - +7.67%
75th Percentile £67,500 £58,756 £74,250
90th Percentile £82,500 £59,000 -
UK median annual salary £50,500 £52,500 £45,000
% change year-on-year -3.81% +16.67% -14.29%

All Systems Management Skills
Work from Home

SCOM falls under the Systems Management category. For comparison with the information above, the following table provides summary statistics for all permanent job vacancies with remote or hybrid options requiring systems management skills.

Permanent vacancies with a requirement for systems management skills 1,860 2,613 4,075
As % of all permanent jobs with a WFH option 11.42% 11.17% 15.98%
Number of salaries quoted 1,030 1,633 3,536
10th Percentile £35,000 £39,000 £42,500
25th Percentile £47,125 £50,000 £52,500
Median annual salary (50th Percentile) £65,000 £66,000 £69,447
Median % change year-on-year -1.52% -4.96% -0.79%
75th Percentile £82,500 £85,000 £85,000
90th Percentile £97,500 £105,000 £100,000
UK median annual salary £62,500 £65,000 £65,000
% change year-on-year -3.85% - -3.70%

SCOM
Trend for Jobs with a WFH Option

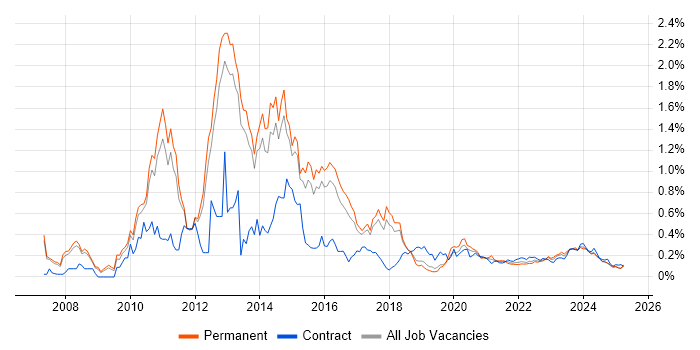
Job vacancies with remote working options citing SCOM as a proportion of all IT jobs advertised.

SCOM trend for jobs with Hybrid/Remote/WFH options

SCOM
Salary Trend for Jobs with Hybrid Work Options

Salary distribution trend for jobs with remote work options citing SCOM.

Salary distribution trend for jobs with remote work options citing SCOM

SCOM
Salary Histogram for Jobs with a WFH Option

Salary distribution for jobs with remote working options citing SCOM over the 6 months to 13 September 2025.

SCOM salary histogram for jobs with a WFH option

SCOM
Co-occurring Skills and Capabilities with WFH Options by Category

The follow tables expand on the table above by listing co-occurrences grouped by category. The same employment type, locality and period is covered with up to 20 co-occurrences shown in each of the following categories:

Application Platforms
1 2 (14.29%) Microsoft Exchange
1 2 (14.29%) SharePoint
1 2 (14.29%) Skype for Business
Cloud Services
1 9 (64.29%) AWS
2 3 (21.43%) Azure
2 3 (21.43%) Microsoft 365
3 2 (14.29%) AWS CodePipeline
3 2 (14.29%) Azure DevOps
3 2 (14.29%) Azure Monitor
4 1 (7.14%) Entra ID
4 1 (7.14%) IaaS
4 1 (7.14%) PaaS
Communications & Networking
1 11 (78.57%) DHCP
1 11 (78.57%) DNS
2 4 (28.57%) TCP/IP
3 3 (21.43%) SAN
4 2 (14.29%) Firewall
4 2 (14.29%) Network Security
4 2 (14.29%) Skype
Database & Business Intelligence
1 2 (14.29%) SQL Server
Development Applications
1 2 (14.29%) Jenkins
General
1 4 (28.57%) Analytical Skills
1 4 (28.57%) Law
2 3 (21.43%) Social Skills
3 1 (7.14%) Public Sector
Job Titles
1 9 (64.29%) Infrastructure Engineer
2 4 (28.57%) Senior
3 3 (21.43%) Azure Engineer
3 3 (21.43%) Senior Infrastructure Engineer
4 2 (14.29%) Lead
5 1 (7.14%) 3rd Line Engineer
5 1 (7.14%) 3rd Line Infrastructure Engineer
5 1 (7.14%) Azure Infrastructure Engineer
5 1 (7.14%) Cloud Engineer
5 1 (7.14%) Lead Infrastructure Engineer
5 1 (7.14%) Platform Engineer
5 1 (7.14%) Senior Cloud Engineer
5 1 (7.14%) Support Engineer
5 1 (7.14%) Technical Leader
Libraries, Frameworks & Software Standards
1 2 (14.29%) Elastic Stack
Miscellaneous
1 4 (28.57%) Hybrid Cloud
2 2 (14.29%) Cloud Native
2 2 (14.29%) Management Information System
2 2 (14.29%) Self-Motivation
3 1 (7.14%) Clustering
3 1 (7.14%) Public Cloud
Operating Systems
1 12 (85.71%) Windows
1 12 (85.71%) Windows Server
2 9 (64.29%) Linux
2 9 (64.29%) Red Hat Enterprise Linux
3 2 (14.29%) Windows Server 2003
3 2 (14.29%) Windows Server 2019
4 1 (7.14%) Windows Server 2012
Processes & Methodologies
1 11 (78.57%) Infrastructure Engineering
2 7 (50.00%) Containerisation
3 5 (35.71%) Mentoring
4 4 (28.57%) Artificial Intelligence
4 4 (28.57%) Collaborative Culture
4 4 (28.57%) Cybersecurity
4 4 (28.57%) High Availability
4 4 (28.57%) Machine Learning
4 4 (28.57%) Problem-Solving
4 4 (28.57%) Technical Leadership
4 4 (28.57%) Vulnerability Remediation
5 3 (21.43%) Infrastructure as Code
5 3 (21.43%) Scrum
6 2 (14.29%) CI/CD
6 2 (14.29%) Coaching
6 2 (14.29%) DevOps
6 2 (14.29%) Observability
6 2 (14.29%) People Management
6 2 (14.29%) Performance Monitoring
6 2 (14.29%) Performance Tuning
Programming Languages
1 9 (64.29%) PowerShell
1 9 (64.29%) Python
2 3 (21.43%) SQL
3 2 (14.29%) Bash
3 2 (14.29%) Perl
4 1 (7.14%) Bicep
Qualifications
1 7 (50.00%) AWS Certification
2 5 (35.71%) Security Cleared
3 4 (28.57%) DV Cleared
4 3 (21.43%) AWS Certified Cloud Practitioner
4 3 (21.43%) AWS Certified SysOps Administrator
5 2 (14.29%) Degree
6 1 (7.14%) SC Cleared
Quality Assurance & Compliance
1 3 (21.43%) SLA
2 2 (14.29%) ISO/IEC 27001
System Software
1 10 (71.43%) Active Directory
1 10 (71.43%) Hyper-V
2 3 (21.43%) VMware Infrastructure
Systems Management
1 9 (64.29%) Ansible
1 9 (64.29%) SCCM
2 7 (50.00%) Microsoft Data Protection Manager
2 7 (50.00%) WSUS
3 5 (35.71%) Kubernetes
4 3 (21.43%) Terraform
5 2 (14.29%) Progress Chef
5 2 (14.29%) Puppet
5 2 (14.29%) SCOrch
5 2 (14.29%) SCSM
Vendors
1 10 (71.43%) Microsoft
2 9 (64.29%) Red Hat
3 7 (50.00%) Oracle
4 3 (21.43%) VMware
5 2 (14.29%) ArcSight
5 2 (14.29%) ServiceNow
5 2 (14.29%) SolarWinds
5 2 (14.29%) Splunk
6 1 (7.14%) Dell
6 1 (7.14%) HP