Hybrid/Remote Support Engineer Job Trends

Support Engineer
UK > Work from Home

The median Support Engineer salary for remote/hybrid work is £40,000 per year, according to job vacancies posted during the 6 months leading to 22 November 2025.

The table below compares current salary benchmarking and summary statistics with the previous two years.

6 months to
22 Nov 2025
Same period 2024 Same period 2023
Rank 124 184 147
Rank change year-on-year +60 -37 +98
Permanent jobs requiring a Support Engineer 338 359 495
As % of all permanent jobs with remote/hybrid work options 2.21% 1.78% 2.31%
As % of the Job Titles category 2.36% 1.84% 2.40%
Number of salaries quoted 278 292 453
10th Percentile £28,000 £29,000 £24,500
25th Percentile £31,250 £31,250 £29,750
Median annual salary (50th Percentile) £40,000 £36,500 £36,500
Median % change year-on-year +9.59% - +4.29%
75th Percentile £51,250 £47,500 £51,250
90th Percentile £61,250 £51,250 £67,500
UK median annual salary £36,500 £35,015 £35,000
% change year-on-year +4.24% +0.04% +4.48%

All Permanent IT Job Vacancies
Work from Home

For comparison with the information above, the following table provides summary statistics for all permanent IT job vacancies with remote/hybrid work options. Most job vacancies include a discernible job title that can be normalized. As such, the figures in the second row provide an indication of the number of permanent jobs in our overall sample.

Permanent vacancies in Work from Home with a recognized job title 14,331 19,479 20,593
% of permanent jobs with a recognized job title 93.71% 96.55% 95.92%
Number of salaries quoted 9,156 12,285 16,842
10th Percentile £29,750 £35,000 £36,250
25th Percentile £40,000 £45,000 £46,250
Median annual salary (50th Percentile) £57,000 £60,000 £61,000
Median % change year-on-year -5.00% -1.64% -2.40%
75th Percentile £77,500 £80,000 £80,000
90th Percentile £95,000 £97,500 £97,500
UK median annual salary £53,500 £57,500 £60,000
% change year-on-year -6.96% -4.17% -

Support Engineer
Job Vacancy Trend for Remote/Hybrid Roles

Historical trend showing the proportion of permanent IT job postings featuring 'Support Engineer' in the job title and offering remote or hybrid work options relative to all permanent IT jobs advertised.
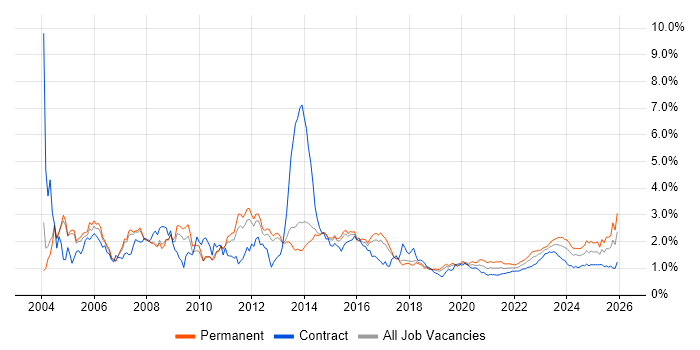
Support Engineer job vacancy trend for remote/hybrid roles

Support Engineer
Salary Trend for Remote/Hybrid Jobs

Salary distribution trend for remote Support Engineer job vacancies.

Salary distribution trend for remote Support Engineer job vacancies

Support Engineer
Salary Histogram for Remote/Hybrid Jobs

Salary distribution for jobs with remote/hybrid work options citing Support Engineer over the 6 months to 22 November 2025.

Support Engineer salary histogram for jobs with remote/hybrid work options

Support Engineer Skill Set
Top 30 Co-Occurring Skills & Capabilities in Remote/Hybrid Jobs

For the 6 months to 22 November 2025, Support Engineer job roles required the following skills and capabilities in order of popularity. The figures indicate the absolute number of co-occurrences and as a proportion of all permanent jobs with hybrid/remote work options featuring Support Engineer in the job title.

1 149 (44.08%) Windows
2 119 (35.21%) Azure
3 112 (33.14%) Microsoft 365
4 111 (32.84%) Microsoft
5 96 (28.40%) Problem-Solving
6 92 (27.22%) Customer Service
7 84 (24.85%) Active Directory
8 72 (21.30%) Windows Server
9 69 (20.41%) Degree
10 59 (17.46%) Cybersecurity
10 59 (17.46%) ITIL
11 57 (16.86%) Microsoft Intune
12 53 (15.68%) Mentoring
12 53 (15.68%) SQL
13 50 (14.79%) Linux
14 49 (14.50%) Entra ID
15 45 (13.31%) AWS
15 45 (13.31%) Firewall
16 41 (12.13%) SQL Server
17 40 (11.83%) Continuous Improvement
18 37 (10.95%) VMware
18 37 (10.95%) VPN
18 37 (10.95%) Windows 10
19 33 (9.76%) Microsoft Exchange
19 33 (9.76%) SharePoint
19 33 (9.76%) SLA
20 31 (9.17%) DevOps
21 30 (8.88%) Microsoft Certification
22 29 (8.58%) Security Cleared
23 27 (7.99%) DNS

Support Engineer Skill Set
Co-Occurring Skills & Capabilities in Remote/Hybrid Jobs by Category

The following tables expand on the one above by listing co-occurrences grouped by category. They cover the same employment type, locality and period, with up to 20 co-occurrences shown in each category:

Application Platforms
1 33 (9.76%) Microsoft Exchange
1 33 (9.76%) SharePoint
2 6 (1.78%) IIS
2 6 (1.78%) Tomcat
2 6 (1.78%) WebSphere
2 6 (1.78%) WebSphere Application Server
3 4 (1.18%) Anypoint
3 4 (1.18%) Oracle Workflow
Applications
1 25 (7.40%) Microsoft Office
2 5 (1.48%) Microsoft Project
Business Applications
1 5 (1.48%) Dynamics NAV
2 4 (1.18%) NEC Housing
2 4 (1.18%) Salesforce CRM
2 4 (1.18%) Shopify
3 2 (0.59%) NetSuite
3 2 (0.59%) Oracle ERP
Cloud Services
1 119 (35.21%) Azure
2 112 (33.14%) Microsoft 365
3 49 (14.50%) Entra ID
4 45 (13.31%) AWS
5 26 (7.69%) SaaS
6 15 (4.44%) OneDrive
7 10 (2.96%) IaaS
8 9 (2.66%) GCP
8 9 (2.66%) Google Workspace
9 8 (2.37%) AWS CloudFormation
10 7 (2.07%) Power Automate
11 6 (1.78%) Amazon EC2
11 6 (1.78%) Amazon ECR
11 6 (1.78%) Amazon EKS
11 6 (1.78%) Amazon S3
11 6 (1.78%) AWS Lambda
11 6 (1.78%) Route 53
11 6 (1.78%) Serverless
11 6 (1.78%) Virtual Private Cloud
12 5 (1.48%) PaaS
Communications & Networking
1 45 (13.31%) Firewall
2 37 (10.95%) VPN
3 27 (7.99%) DNS
4 22 (6.51%) TCP/IP
5 20 (5.92%) DHCP
6 19 (5.62%) Wi-Fi
7 17 (5.03%) LAN
8 15 (4.44%) WAN
9 13 (3.85%) VLAN
9 13 (3.85%) VoIP
10 11 (3.25%) Internet
11 8 (2.37%) SSL
12 7 (2.07%) IP Telephony
13 6 (1.78%) SAN
14 5 (1.48%) DMZ
14 5 (1.48%) Modbus
14 5 (1.48%) Remote Desktop
14 5 (1.48%) STUN
14 5 (1.48%) Wireless
15 4 (1.18%) Unified Communications
Database & Business Intelligence
1 41 (12.13%) SQL Server
2 14 (4.14%) MySQL
3 11 (3.25%) PostgreSQL
4 9 (2.66%) Azure SQL Database
5 6 (1.78%) Amazon RDS
5 6 (1.78%) DB2
5 6 (1.78%) MariaDB
5 6 (1.78%) SQL Server Reporting Services
6 5 (1.48%) Relational Database
7 4 (1.18%) BusinessObjects
7 4 (1.18%) MS Access
7 4 (1.18%) SAP Data Services
8 3 (0.89%) Oracle Database
9 2 (0.59%) NoSQL
10 1 (0.30%) Elasticsearch
10 1 (0.30%) Power BI
Development Applications
1 4 (1.18%) Toad
2 2 (0.59%) GitLab
2 2 (0.59%) Jenkins
3 1 (0.30%) Fiddler
3 1 (0.30%) Visual Studio
General
1 137 (40.53%) Social Skills
2 29 (8.58%) Finance
3 17 (5.03%) Organisational Skills
4 15 (4.44%) Back Office
5 14 (4.14%) Inclusion and Diversity
6 12 (3.55%) Analytical Skills
6 12 (3.55%) Automotive
6 12 (3.55%) Telecoms
7 10 (2.96%) Documentation Skills
8 8 (2.37%) Legal
8 8 (2.37%) Public Sector
9 7 (2.07%) Banking
9 7 (2.07%) Retail
10 6 (1.78%) Law
11 4 (1.18%) Local Government
11 4 (1.18%) Manufacturing
11 4 (1.18%) Marketing
12 3 (0.89%) Front Office
12 3 (0.89%) Games
13 2 (0.59%) Electronics
Libraries, Frameworks & Software Standards
1 9 (2.66%) CSS
2 6 (1.78%) .NET
2 6 (1.78%) LAPP Stack
2 6 (1.78%) LDAP
2 6 (1.78%) WebSphere MQ
3 5 (1.48%) .NET Framework
3 5 (1.48%) Entity Framework
3 5 (1.48%) FreeSWITCH
3 5 (1.48%) JSON
3 5 (1.48%) RESTful
3 5 (1.48%) WinForms
4 4 (1.18%) REST
4 4 (1.18%) SOAP
4 4 (1.18%) Web Services
4 4 (1.18%) XML
5 3 (0.89%) Elastic Stack
5 3 (0.89%) LAMP
6 2 (0.59%) React
7 1 (0.30%) Node.js
7 1 (0.30%) OpenID
Miscellaneous
1 61 (18.05%) Driving Licence
2 41 (12.13%) Self-Motivation
3 15 (4.44%) Onboarding
4 11 (3.25%) CCTV
5 7 (2.07%) Client/Server
5 7 (2.07%) Linux Command Line
5 7 (2.07%) Renewable Energy
6 6 (1.78%) Data Centre
7 5 (1.48%) Cyber Security Posture
8 4 (1.18%) Hybrid Cloud
8 4 (1.18%) Low-Code
8 4 (1.18%) Robotics
9 3 (0.89%) BYOD
9 3 (0.89%) Equities
9 3 (0.89%) Foreign Exchange (FX)
9 3 (0.89%) Legacy Systems
9 3 (0.89%) Life Science
9 3 (0.89%) Solar Energy
10 2 (0.59%) Enterprise Software
10 2 (0.59%) Public Cloud
Operating Systems
1 149 (44.08%) Windows
2 72 (21.30%) Windows Server
3 50 (14.79%) Linux
4 37 (10.95%) Windows 10
5 21 (6.21%) Unix
6 17 (5.03%) Mac OS
7 11 (3.25%) Apple iOS
7 11 (3.25%) Red Hat Enterprise Linux
8 10 (2.96%) Debian
9 9 (2.66%) Windows Server 2016
10 8 (2.37%) Windows Server 2012
11 6 (1.78%) Windows Server 2019
12 5 (1.48%) Android
12 5 (1.48%) Mac OS X
12 5 (1.48%) Solaris
13 3 (0.89%) CentOS
13 3 (0.89%) Rocky
13 3 (0.89%) Ubuntu
13 3 (0.89%) VMS
Processes & Methodologies
1 96 (28.40%) Problem-Solving
2 92 (27.22%) Customer Service
3 59 (17.46%) Cybersecurity
3 59 (17.46%) ITIL
4 53 (15.68%) Mentoring
5 40 (11.83%) Continuous Improvement
6 31 (9.17%) DevOps
7 26 (7.69%) Infrastructure Engineering
7 26 (7.69%) Root Cause Analysis
8 23 (6.80%) Coaching
9 21 (6.21%) Change Management
9 21 (6.21%) Customer Experience
10 19 (5.62%) Analytics
11 16 (4.73%) Disaster Recovery
11 16 (4.73%) Service Delivery
12 15 (4.44%) Migration
13 14 (4.14%) Agile
13 14 (4.14%) Patch Management
13 14 (4.14%) Ticket Management
14 13 (3.85%) Customer-Centricity
Programming Languages
1 53 (15.68%) SQL
2 25 (7.40%) PowerShell
3 20 (5.92%) Python
4 14 (4.14%) C#
5 11 (3.25%) Shell Script
6 9 (2.66%) Bash
7 7 (2.07%) Java
8 6 (1.78%) PHP
8 6 (1.78%) T-SQL
9 5 (1.48%) Korn
10 4 (1.18%) Bicep
10 4 (1.18%) JavaScript
10 4 (1.18%) VB
11 3 (0.89%) VBA
12 1 (0.30%) Go
12 1 (0.30%) TypeScript
12 1 (0.30%) VB.NET
Qualifications
1 69 (20.41%) Degree
2 30 (8.88%) Microsoft Certification
3 29 (8.58%) Security Cleared
4 19 (5.62%) SC Cleared
5 16 (4.73%) MCP
6 13 (3.85%) Computer Science Degree
6 13 (3.85%) MCSA
6 13 (3.85%) MCSE
7 12 (3.55%) CTC Cleared
8 10 (2.96%) CCNA
8 10 (2.96%) Cisco Certification
9 9 (2.66%) ITIL Certification
10 7 (2.07%) Azure Certification
10 7 (2.07%) CCNP
11 6 (1.78%) AWS Certification
12 5 (1.48%) DBS Check
13 4 (1.18%) A+ Certification
14 3 (0.89%) BPSS Clearance
14 3 (0.89%) HNC
14 3 (0.89%) Network+ Certification
Quality Assurance & Compliance
1 33 (9.76%) SLA
2 12 (3.55%) Cyber Essentials
2 12 (3.55%) ISO/IEC 27001
3 9 (2.66%) GDPR
4 5 (1.48%) ISO 9001
5 2 (0.59%) PCI DSS
6 1 (0.30%) QA
System Software
1 84 (24.85%) Active Directory
2 27 (7.99%) Hyper-V
3 24 (7.10%) VMware Infrastructure
4 13 (3.85%) Docker
5 5 (1.48%) Kamailio
5 5 (1.48%) Virtual Machines
6 4 (1.18%) XenApp
7 3 (0.89%) BitLocker
8 2 (0.59%) vSphere
9 1 (0.30%) Virtual Servers
Systems Management
1 57 (16.86%) Microsoft Intune
2 14 (4.14%) Terraform
3 13 (3.85%) Ansible
3 13 (3.85%) Kubernetes
4 5 (1.48%) Jamf Pro
5 4 (1.18%) Active Directory Federation Services
5 4 (1.18%) Autotask
5 4 (1.18%) Grafana
5 4 (1.18%) Prometheus
5 4 (1.18%) SCOM
6 3 (0.89%) Control-M
6 3 (0.89%) Nagios
7 1 (0.30%) Docker Swarm
7 1 (0.30%) SCCM
7 1 (0.30%) Single Sign-On
Vendors
1 111 (32.84%) Microsoft
2 37 (10.95%) VMware
3 19 (5.62%) Cisco
4 17 (5.03%) Google
5 14 (4.14%) SAP
5 14 (4.14%) Siemens
6 13 (3.85%) Oracle
7 11 (3.25%) Salesforce
8 10 (2.96%) IBM
9 8 (2.37%) Veeam
10 7 (2.07%) Dell
10 7 (2.07%) Draytek
10 7 (2.07%) Mitel
10 7 (2.07%) Red Hat
10 7 (2.07%) WatchGuard
11 5 (1.48%) Citrix
11 5 (1.48%) NetApp
11 5 (1.48%) Progress
11 5 (1.48%) Sage
11 5 (1.48%) Toshiba