Hybrid/Remote PaaS Job Trends

Platform as a Service (PaaS)
UK > Work from Home

The table below provides summary statistics and salary benchmarking for remote or hybrid work requiring PaaS skills. It covers permanent job vacancies from the 6 months leading up to 20 October 2025, with comparisons to the same periods in the previous two years.

6 months to
20 Oct 2025
Same period 2024 Same period 2023
Rank 290 229 121
Rank change year-on-year -61 -108 +78
Permanent jobs citing PaaS 128 280 639
As % of all permanent jobs with remote/hybrid work options 0.79% 1.39% 2.75%
As % of the Cloud Services category 2.27% 3.17% 5.73%
Number of salaries quoted 98 162 441
10th Percentile £41,350 £49,775 £47,500
25th Percentile £53,813 £56,250 £58,750
Median annual salary (50th Percentile) £75,000 £66,250 £72,500
Median % change year-on-year +13.21% -8.62% +5.07%
75th Percentile £83,656 £78,438 £85,000
90th Percentile £102,225 £92,000 £106,250
UK median annual salary £67,500 £67,500 £70,576
% change year-on-year - -4.36% +0.82%

All Cloud Skills
Work from Home

PaaS falls under the Cloud Services category. For comparison with the information above, the following table provides summary statistics for all permanent job vacancies with remote or hybrid options requiring cloud computing skills.

Permanent vacancies with a requirement for cloud computing skills 5,644 8,838 11,153
As % of all permanent jobs with a WFH option 34.82% 43.74% 48.01%
Number of salaries quoted 3,994 5,809 9,516
10th Percentile £31,250 £36,500 £37,500
25th Percentile £42,000 £48,000 £48,250
Median annual salary (50th Percentile) £60,000 £65,000 £65,000
Median % change year-on-year -7.69% - -
75th Percentile £82,500 £86,250 £82,500
90th Percentile £110,000 £115,000 £99,250
UK median annual salary £57,500 £65,000 £62,500
% change year-on-year -11.54% +4.00% -

PaaS
Job Vacancy Trend for Remote/Hybrid Jobs

Historical trend showing the proportion of permanent IT job postings citing PaaS and offering remote or hybrid work options relative to all permanent IT jobs advertised.
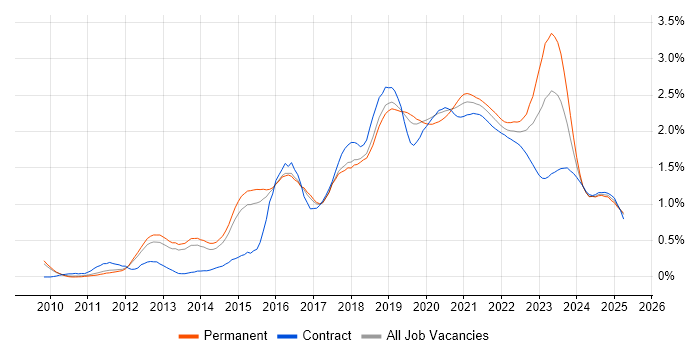
PaaS job vacancy trend for remote/hybrid jobs

PaaS
Salary Trend for Remote/Hybrid Jobs

Salary distribution trend for jobs with remote/hybrid work options citing PaaS.

Salary distribution trend for jobs with remote/hybrid work options citing PaaS

PaaS
Salary Histogram for Remote/Hybrid Jobs

Salary distribution for jobs with remote/hybrid work options citing PaaS over the 6 months to 20 October 2025.

PaaS salary histogram for jobs with remote/hybrid work options

PaaS
Co-Occurring Skills & Capabilities in Remote/Hybrid Jobs by Category

The following tables expand on the one above by listing co-occurrences grouped by category. They cover the same employment type, locality and period, with up to 20 co-occurrences shown in each category:

Application Platforms
1 6 (4.69%) SharePoint
2 2 (1.56%) IIS
2 2 (1.56%) Microsoft Exchange
3 1 (0.78%) Apache
3 1 (0.78%) Confluence
Applications
1 1 (0.78%) Microsoft Excel
1 1 (0.78%) Trello
Business Applications
1 3 (2.34%) Shopify
Cloud Services
1 113 (88.28%) Azure
2 79 (61.72%) IaaS
2 79 (61.72%) SaaS
3 47 (36.72%) Azure DevOps
4 44 (34.38%) AWS
5 40 (31.25%) Entra ID
6 29 (22.66%) Power Platform
7 26 (20.31%) Azure Monitor
8 23 (17.97%) Azure Key Vault
8 23 (17.97%) Azure Service Bus
9 20 (15.63%) GCP
9 20 (15.63%) Power Automate
10 19 (14.84%) Serverless
11 16 (12.50%) Azure AI
11 16 (12.50%) Azure ExpressRoute
12 15 (11.72%) GitHub
13 10 (7.81%) Microsoft 365
14 9 (7.03%) Azure Logic Apps
14 9 (7.03%) GitHub Actions
14 9 (7.03%) OCI
Communications & Networking
1 26 (20.31%) Firewall
2 25 (19.53%) VPN
3 24 (18.75%) DNS
4 18 (14.06%) WAN
5 16 (12.50%) SD-WAN
6 5 (3.91%) TCP/IP
7 3 (2.34%) DHCP
7 3 (2.34%) Network Security
8 2 (1.56%) LAN
9 1 (0.78%) SAN
Database & Business Intelligence
1 19 (14.84%) MySQL
1 19 (14.84%) Power BI
2 17 (13.28%) Data Lake
3 12 (9.38%) SQL Server
4 7 (5.47%) NoSQL
5 4 (3.13%) PostgreSQL
6 3 (2.34%) Data Warehouse
7 2 (1.56%) MariaDB
7 2 (1.56%) SQL Server Integration Services
7 2 (1.56%) SQL Server Reporting Services
7 2 (1.56%) Star Schema
8 1 (0.78%) Amazon RDS
8 1 (0.78%) Azure SQL Database
8 1 (0.78%) Metadata
8 1 (0.78%) Power Query
8 1 (0.78%) RDBMS
8 1 (0.78%) Relational Database
Development Applications
1 30 (23.44%) Git
2 4 (3.13%) Jenkins
3 2 (1.56%) JIRA
3 2 (1.56%) SQL Server Management Studio (SSMS)
4 1 (0.78%) Visual Studio
General
1 35 (27.34%) Social Skills
2 17 (13.28%) Law
3 15 (11.72%) Analytical Skills
4 13 (10.16%) Public Sector
5 12 (9.38%) Finance
6 8 (6.25%) Inclusion and Diversity
7 4 (3.13%) Telecoms
8 3 (2.34%) Local Government
9 2 (1.56%) Advertising
10 1 (0.78%) Legal
10 1 (0.78%) Marketing
10 1 (0.78%) Retail
Job Titles
1 45 (35.16%) Architect
2 30 (23.44%) Lead
3 27 (21.09%) Cloud Architect
4 20 (15.63%) Azure Engineer
5 18 (14.06%) Cloud Engineer
6 10 (7.81%) Analyst
6 10 (7.81%) Developer
7 8 (6.25%) Product Manager
7 8 (6.25%) Solutions Architect
8 7 (5.47%) .NET Developer
8 7 (5.47%) Azure Developer
8 7 (5.47%) Enterprise Architect
8 7 (5.47%) Infrastructure Engineer
8 7 (5.47%) Lead .NET Developer
8 7 (5.47%) Lead Developer
8 7 (5.47%) Lead Product Manager
9 6 (4.69%) Lead Architect
9 6 (4.69%) SaaS Developer
9 6 (4.69%) Security Engineer
9 6 (4.69%) Support Engineer
Libraries, Frameworks & Software Standards
1 16 (12.50%) .NET
2 13 (10.16%) .NET Framework
3 11 (8.59%) JSON
4 9 (7.03%) RESTful
4 9 (7.03%) YAML
5 7 (5.47%) ASP.NET Web API
5 7 (5.47%) ASP.NET Web Forms
5 7 (5.47%) Entity Framework
5 7 (5.47%) Middleware
5 7 (5.47%) Node.js
5 7 (5.47%) Razor View Engine
5 7 (5.47%) React
6 2 (1.56%) .NET Core
6 2 (1.56%) CSS
6 2 (1.56%) HTML
6 2 (1.56%) REST
6 2 (1.56%) Smarty
6 2 (1.56%) Symfony
6 2 (1.56%) Web Services
7 1 (0.78%) LAMP
Miscellaneous
1 17 (13.28%) Data Centre
2 16 (12.50%) NHS
3 15 (11.72%) Cloud Native
4 13 (10.16%) Public Cloud
5 8 (6.25%) Hybrid Cloud
6 7 (5.47%) Management Information System
6 7 (5.47%) Private Cloud
7 5 (3.91%) Augmented Reality
7 5 (3.91%) Driving Licence
7 5 (3.91%) Legacy Systems
7 5 (3.91%) Onboarding
8 3 (2.34%) Clustering
8 3 (2.34%) Enterprise Cloud
8 3 (2.34%) Greenfield Project
8 3 (2.34%) Replication
9 2 (1.56%) Distributed Systems
9 2 (1.56%) Enterprise Software
9 2 (1.56%) Product Ownership
9 2 (1.56%) Self-Motivation
10 1 (0.78%) Security Posture
Operating Systems
1 25 (19.53%) Windows
2 13 (10.16%) Linux
2 13 (10.16%) Windows Server
3 6 (4.69%) VMS
4 3 (2.34%) Windows Server 2012
5 2 (1.56%) Unix
5 2 (1.56%) Windows Server 2008
5 2 (1.56%) Windows Server 2016
5 2 (1.56%) Windows Server 2019
6 1 (0.78%) Android
Processes & Methodologies
1 71 (55.47%) DevOps
2 64 (50.00%) Agile
3 54 (42.19%) Infrastructure as Code
4 47 (36.72%) CI/CD
5 46 (35.94%) Roadmaps
6 39 (30.47%) Analytics
7 33 (25.78%) Mentoring
7 33 (25.78%) Migration
8 31 (24.22%) ITIL
9 30 (23.44%) AI
9 30 (23.44%) Test Automation
10 25 (19.53%) Cloud Security
11 24 (18.75%) Continuous Improvement
12 23 (17.97%) Collaborative Culture
12 23 (17.97%) Problem-Solving
13 22 (17.19%) B2B
13 22 (17.19%) Log Analytics
13 22 (17.19%) TOGAF
14 20 (15.63%) Microservices
14 20 (15.63%) Waterfall
Programming Languages
1 51 (39.84%) PowerShell
2 37 (28.91%) SQL
3 31 (24.22%) Bicep
4 14 (10.94%) Python
5 9 (7.03%) C#
5 9 (7.03%) TypeScript
6 6 (4.69%) JavaScript
7 4 (3.13%) Bash
8 2 (1.56%) Java
8 2 (1.56%) PHP
9 1 (0.78%) PL/SQL
Qualifications
1 38 (29.69%) Azure Certification
2 27 (21.09%) Degree
3 20 (15.63%) Microsoft Certification
4 18 (14.06%) Security Cleared
5 16 (12.50%) DBS Check
6 14 (10.94%) Master's Degree
7 13 (10.16%) SC Cleared
8 11 (8.59%) Computer Science Degree
9 7 (5.47%) DV Cleared
10 6 (4.69%) BPSS Clearance
10 6 (4.69%) MCSA
11 5 (3.91%) CCNA
11 5 (3.91%) CCNP
11 5 (3.91%) Cisco Certification
11 5 (3.91%) MCP
11 5 (3.91%) MCSE
12 2 (1.56%) AWS Certification
13 1 (0.78%) AWS Certified Solutions Architect
13 1 (0.78%) CISM
13 1 (0.78%) CISSP
Quality Assurance & Compliance
1 15 (11.72%) ISO/IEC 27001
2 12 (9.38%) NIST
3 11 (8.59%) NCSC
4 8 (6.25%) QA
5 5 (3.91%) GDPR
5 5 (3.91%) Sarbanes-Oxley
6 3 (2.34%) Data Quality
7 2 (1.56%) Cyber Essentials
8 1 (0.78%) Cyber Essentials PLUS
8 1 (0.78%) GRC
8 1 (0.78%) SLA
System Software
1 28 (21.88%) Virtual Machines
2 24 (18.75%) Active Directory
3 12 (9.38%) VMware Infrastructure
4 8 (6.25%) Hyper-V
5 2 (1.56%) Docker
5 2 (1.56%) VMware ESXi
6 1 (0.78%) KVM
6 1 (0.78%) Xen
Systems Management
1 29 (22.66%) Terraform
2 16 (12.50%) Single Sign-On
3 11 (8.59%) Ansible
4 7 (5.47%) Kubernetes
5 6 (4.69%) SCOM
6 4 (3.13%) Microsoft Intune
7 1 (0.78%) CASB
7 1 (0.78%) CFEngine
7 1 (0.78%) Progress Chef
7 1 (0.78%) Puppet
7 1 (0.78%) SCCM
Vendors
1 49 (38.28%) Microsoft
2 18 (14.06%) Databricks
3 16 (12.50%) Meraki
4 14 (10.94%) VMware
5 4 (3.13%) BiZZdesign
5 4 (3.13%) Oracle
6 3 (2.34%) Google
7 2 (1.56%) EMC
7 2 (1.56%) Salesforce
7 2 (1.56%) Sparx
7 2 (1.56%) TOWER Software
8 1 (0.78%) Dell
8 1 (0.78%) HP
8 1 (0.78%) Juniper
8 1 (0.78%) Mercator
8 1 (0.78%) Veeam
8 1 (0.78%) Xamarin