Microsoft Certification Jobs with Hybrid/Remote/WFH Options

Microsoft Certification
UK > Work from Home

The table below provides summary statistics for remote or hybrid work with a requirement for Microsoft Certification qualifications. It includes a benchmarking guide to the salaries offered over the 6 months leading up to 1 May 2025, comparing them to the same period in the previous two years.

6 months to
1 May 2025
Same period 2024 Same period 2023
Rank 216 228 320
Rank change year-on-year +12 +92 +24
Permanent jobs citing Microsoft Certification 198 474 413
As % of all permanent jobs with a WFH option 1.32% 1.40% 0.97%
As % of the Qualifications category 4.21% 4.99% 3.80%
Number of salaries quoted 163 402 366
10th Percentile £29,750 £30,775 £25,250
25th Percentile £36,250 £36,938 £32,625
Median annual salary (50th Percentile) £50,000 £50,000 £50,000
75th Percentile £62,500 £61,250 £61,250
90th Percentile £77,500 £67,500 £72,500
UK median annual salary £45,000 £45,000 £46,000
% change year-on-year - -2.17% -1.60%

All Academic and Professional Certifications
Work from Home

Microsoft Certification falls under the Academic Qualifications and Professional Certifications category. For comparison with the information above, the following table provides summary statistics for all permanent job vacancies with remote or hybrid options requiring academic qualifications or professional certifications.

Permanent vacancies requiring academic qualifications or professional certifications 4,703 9,496 10,878
As % of all permanent jobs with a WFH option 31.45% 28.06% 25.44%
Number of salaries quoted 3,034 5,942 6,655
10th Percentile £31,250 £32,500 £35,000
25th Percentile £46,777 £42,500 £45,000
Median annual salary (50th Percentile) £55,000 £57,000 £60,000
Median % change year-on-year -3.51% -5.00% +0.45%
75th Percentile £70,600 £72,500 £77,715
90th Percentile £85,000 £87,500 £95,000
UK median annual salary £55,000 £54,000 £58,000
% change year-on-year +1.85% -6.90% +5.45%

Microsoft Certification
Trend for Jobs with a WFH Option

Job vacancies with remote working options citing Microsoft Certification as a proportion of all IT jobs advertised.
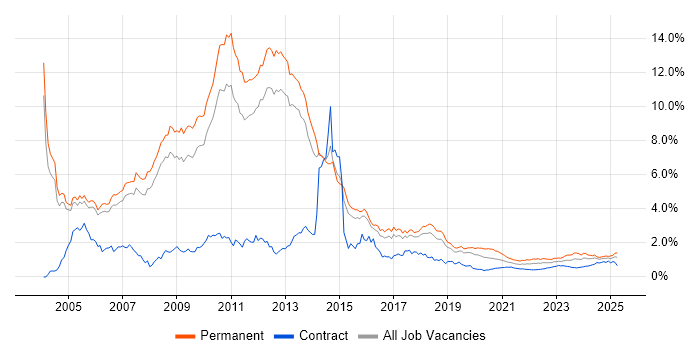
Microsoft Certification trend for jobs with Hybrid/Remote/WFH options

Microsoft Certification
Salary Trend for Jobs with a WFH Option

3-month moving average salary quoted in job vacancies with remote working options citing Microsoft Certification.

Microsoft Certification salary trend for jobs with a WFH option

Microsoft Certification
Salary Histogram for Jobs with a WFH Option

Salary distribution for jobs with remote working options citing Microsoft Certification over the 6 months to 1 May 2025.

Microsoft Certification salary histogram for jobs with a WFH option

Microsoft Certification
Co-occurring Skills and Capabilities with WFH Options by Category

The follow tables expand on the table above by listing co-occurrences grouped by category. The same employment type, locality and period is covered with up to 20 co-occurrences shown in each of the following categories:

Application Platforms
1 36 (18.18%) SharePoint
2 17 (8.59%) Microsoft Exchange
3 3 (1.52%) IIS
4 2 (1.01%) Apache
4 2 (1.01%) Apache Spark
Applications
1 15 (7.58%) Microsoft Office
2 5 (2.53%) Adobe XD
2 5 (2.53%) Microsoft Excel
2 5 (2.53%) Microsoft PowerPoint
3 3 (1.52%) Microsoft Project
4 1 (0.51%) Camtasia
4 1 (0.51%) Spreadsheet
Business Applications
1 12 (6.06%) Dynamics CRM
2 3 (1.52%) Elite 3E
2 3 (1.52%) Sage 50
3 2 (1.01%) Dynamics AX
4 1 (0.51%) Oracle Payables
Cloud Services
1 129 (65.15%) Azure
2 85 (42.93%) Microsoft 365
3 41 (20.71%) AWS
4 39 (19.70%) Power Platform
5 34 (17.17%) Dynamics 365
6 28 (14.14%) Entra ID
6 28 (14.14%) SaaS
7 25 (12.63%) PowerApps
8 22 (11.11%) Azure DevOps
9 20 (10.10%) PaaS
9 20 (10.10%) Power Automate
10 16 (8.08%) IaaS
11 14 (7.07%) OneDrive
12 11 (5.56%) Azure Sentinel
13 10 (5.05%) Azure Data Factory
13 10 (5.05%) GCP
14 8 (4.04%) GitHub
15 7 (3.54%) Cloud Computing
15 7 (3.54%) Microsoft Purview
16 6 (3.03%) Azure Logic Apps
Communications & Networking
1 29 (14.65%) DNS
2 25 (12.63%) Firewall
3 19 (9.60%) DHCP
4 18 (9.09%) WAN
5 16 (8.08%) LAN
6 14 (7.07%) VPN
7 10 (5.05%) Remote Desktop
8 9 (4.55%) VLAN
9 8 (4.04%) SD-WAN
9 8 (4.04%) VoIP
9 8 (4.04%) VSAN
10 6 (3.03%) SAN
10 6 (3.03%) Wireless
11 5 (2.53%) NAS
11 5 (2.53%) TCP/IP
12 4 (2.02%) HTTPS
12 4 (2.02%) Wi-Fi
13 2 (1.01%) Intrusion Detection
13 2 (1.01%) Network Security
13 2 (1.01%) Wireless Security
Database & Business Intelligence
1 29 (14.65%) SQL Server
2 16 (8.08%) Power BI
3 5 (2.53%) Azure SQL Database
3 5 (2.53%) MongoDB
3 5 (2.53%) PostgreSQL
4 3 (1.52%) Amazon Redshift
4 3 (1.52%) Data Warehouse
5 2 (1.01%) BigQuery
5 2 (1.01%) Data Lake
5 2 (1.01%) Hadoop
5 2 (1.01%) NoSQL
5 2 (1.01%) Relational Database
6 1 (0.51%) Amazon RDS
6 1 (0.51%) MariaDB
6 1 (0.51%) MySQL
6 1 (0.51%) Oracle Database
6 1 (0.51%) Power Query
6 1 (0.51%) SQL Server Reporting Services
Development Applications
1 10 (5.05%) Git
1 10 (5.05%) JIRA
2 5 (2.53%) Axure RP
2 5 (2.53%) Balsamiq
2 5 (2.53%) Bitbucket
2 5 (2.53%) Oracle Forms
3 2 (1.01%) Visual Studio
3 2 (1.01%) Visual Studio Code
4 1 (0.51%) GitLab
General
1 100 (50.51%) Social Skills
2 40 (20.20%) Finance
3 21 (10.61%) Analytical Skills
4 16 (8.08%) Marketing
5 11 (5.56%) Public Sector
6 8 (4.04%) Welsh Language
7 7 (3.54%) Inclusion and Diversity
8 6 (3.03%) Law
8 6 (3.03%) Retail
9 5 (2.53%) Banking
9 5 (2.53%) Legal
9 5 (2.53%) Manufacturing
9 5 (2.53%) Presentation Skills
10 4 (2.02%) Humanities
11 3 (1.52%) Advertising
11 3 (1.52%) Automotive
12 2 (1.01%) Organisational Skills
12 2 (1.01%) Telecoms
13 1 (0.51%) Aviation
13 1 (0.51%) Police
Job Titles
1 27 (13.64%) Developer
2 25 (12.63%) IT Support
3 24 (12.12%) Senior
4 18 (9.09%) Consultant
4 18 (9.09%) Infrastructure Engineer
5 17 (8.59%) Cloud Engineer
6 16 (8.08%) Support Engineer
7 14 (7.07%) Analyst
8 13 (6.57%) Server Engineer
9 12 (6.06%) 2nd Line Support
10 11 (5.56%) Azure Engineer
10 11 (5.56%) IT Engineer
10 11 (5.56%) Power Platform Developer
11 9 (4.55%) Cloud Infrastructure Engineer
11 9 (4.55%) Senior Developer
12 8 (4.04%) IT Support Engineer
13 7 (3.54%) Lead
13 7 (3.54%) Microsoft 365 Engineer
13 7 (3.54%) Windows Engineer
14 6 (3.03%) Dynamics 365 Developer
Libraries, Frameworks & Software Standards
1 19 (9.60%) .NET
2 12 (6.06%) .NET Framework
3 9 (4.55%) CSS
3 9 (4.55%) HTML
4 8 (4.04%) ASP.NET
5 5 (2.53%) ASP.NET Core
5 5 (2.53%) CSS3
5 5 (2.53%) Entity Framework
5 5 (2.53%) HTML5
5 5 (2.53%) JSON
5 5 (2.53%) LESS
5 5 (2.53%) Middleware
5 5 (2.53%) Sass
6 3 (1.52%) REST
6 3 (1.52%) RESTful
6 3 (1.52%) SPFx
6 3 (1.52%) Web Services
7 2 (1.01%) .NET Core
7 2 (1.01%) ASP.NET MVC
7 2 (1.01%) SOAP
Miscellaneous
1 14 (7.07%) Management Information System
2 13 (6.57%) Driving Licence
3 11 (5.56%) Self-Motivation
4 10 (5.05%) Data Centre
4 10 (5.05%) Onboarding
5 9 (4.55%) Hybrid Cloud
6 8 (4.04%) Analytical Mindset
6 8 (4.04%) IoT
7 7 (3.54%) Data Structures
7 7 (3.54%) Product Ownership
8 4 (2.02%) Low-Code
8 4 (2.02%) Security Operations Centre
8 4 (2.02%) Video Conferencing
9 3 (1.52%) Cloud Native
9 3 (1.52%) Enterprise Software
9 3 (1.52%) Security Posture
10 2 (1.01%) Enterprise Cloud
10 2 (1.01%) Linux Command Line
10 2 (1.01%) Podcast
10 2 (1.01%) Public Cloud
Operating Systems
1 83 (41.92%) Windows
2 37 (18.69%) Windows Server
3 33 (16.67%) Linux
4 12 (6.06%) Mac OS
4 12 (6.06%) Windows 10
5 6 (3.03%) Windows 7
6 5 (2.53%) Windows Server 2016
7 4 (2.02%) Windows 8
8 3 (1.52%) Android
8 3 (1.52%) Unix
9 2 (1.01%) Red Hat Enterprise Linux
9 2 (1.01%) Windows Server 2019
10 1 (0.51%) Mac OS X
10 1 (0.51%) Solaris
10 1 (0.51%) Windows Server 2008
10 1 (0.51%) Windows Server 2012
Processes & Methodologies
1 90 (45.45%) Problem-Solving
2 53 (26.77%) ITIL
3 40 (20.20%) Agile
4 36 (18.18%) Customer Service
5 35 (17.68%) DevOps
6 30 (15.15%) Mentoring
7 23 (11.62%) Service Management
8 21 (10.61%) CI/CD
9 19 (9.60%) Cybersecurity
9 19 (9.60%) Infrastructure Engineering
10 18 (9.09%) Business Intelligence
10 18 (9.09%) Disaster Recovery
10 18 (9.09%) ITSM
10 18 (9.09%) User Experience
11 17 (8.59%) Change Management
11 17 (8.59%) Project Delivery
12 16 (8.08%) CRM
12 16 (8.08%) Problem Management
13 15 (7.58%) Collaborative Culture
13 15 (7.58%) Data Protection
Programming Languages
1 40 (20.20%) PowerShell
2 29 (14.65%) SQL
3 27 (13.64%) C#
4 23 (11.62%) JavaScript
5 8 (4.04%) T-SQL
6 7 (3.54%) Bash
6 7 (3.54%) Java
7 6 (3.03%) Python
8 5 (2.53%) C
8 5 (2.53%) C++
8 5 (2.53%) Objective-C
8 5 (2.53%) PHP
8 5 (2.53%) X++
9 4 (2.02%) VB
10 3 (1.52%) Kusto Query Language
11 2 (1.01%) Bicep
11 2 (1.01%) R
11 2 (1.01%) TypeScript
12 1 (0.51%) Data Analysis Expressions
12 1 (0.51%) VBScript
Qualifications
1 47 (23.74%) Degree
2 43 (21.72%) Azure Certification
3 37 (18.69%) MCSA
4 34 (17.17%) MCSE
5 27 (13.64%) MCP
6 15 (7.58%) CCNA
6 15 (7.58%) Cisco Certification
7 13 (6.57%) Security Cleared
8 12 (6.06%) Computer Science Degree
8 12 (6.06%) Network+ Certification
9 11 (5.56%) AWS Certification
9 11 (5.56%) DBS Check
10 10 (5.05%) MCITP
10 10 (5.05%) VMware Certified Professional (VCP)
11 7 (3.54%) CCNP
11 7 (3.54%) SC Cleared
12 5 (2.53%) DV Cleared
13 4 (2.02%) AWS Certified Solutions Architect
13 4 (2.02%) CompTIA Security+
13 4 (2.02%) Postgraduate
Quality Assurance & Compliance
1 25 (12.63%) SLA
2 6 (3.03%) Accessibility
3 5 (2.53%) Cyber Essentials
3 5 (2.53%) WCAG
4 3 (1.52%) Cyber Essentials PLUS
4 3 (1.52%) GDPR
4 3 (1.52%) ISO/IEC 27001
4 3 (1.52%) PMO
5 2 (1.01%) Data Quality
5 2 (1.01%) ISO 9001
5 2 (1.01%) QA
6 1 (0.51%) NCSC
6 1 (0.51%) NIST
System Software
1 60 (30.30%) Active Directory
2 20 (10.10%) VMware Infrastructure
3 19 (9.60%) Hyper-V
4 11 (5.56%) Virtual Desktop
5 8 (4.04%) VMware NSX
6 7 (3.54%) Virtual Machines
7 3 (1.52%) Docker
7 3 (1.52%) Firmware
8 2 (1.01%) EMC RecoverPoint
8 2 (1.01%) vSphere
9 1 (0.51%) LXC
9 1 (0.51%) Samba
9 1 (0.51%) Virtual Servers
9 1 (0.51%) VMware ESXi
9 1 (0.51%) XenApp
Systems Management
1 23 (11.62%) Microsoft Intune
2 12 (6.06%) Terraform
3 11 (5.56%) SCCM
4 7 (3.54%) PaperCut
5 6 (3.03%) Progress Chef
6 5 (2.53%) Ansible
7 4 (2.02%) Single Sign-On
7 4 (2.02%) WMI
8 3 (1.52%) Active Directory Federation Services
8 3 (1.52%) vCenter Server
8 3 (1.52%) WSUS
9 2 (1.01%) Dell DRAC
9 2 (1.01%) Failover Clustering
9 2 (1.01%) Kubernetes
9 2 (1.01%) vRealize
9 2 (1.01%) VxRail
10 1 (0.51%) Autotask
10 1 (0.51%) Nagios
10 1 (0.51%) Nessus
Vendors
1 180 (90.91%) Microsoft
2 28 (14.14%) VMware
3 14 (7.07%) Google
4 13 (6.57%) Cisco
5 7 (3.54%) Adobe
5 7 (3.54%) ServiceNow
6 6 (3.03%) Fortinet
6 6 (3.03%) Oracle
6 6 (3.03%) SonicWALL
7 5 (2.53%) Meraki
7 5 (2.53%) Sage
7 5 (2.53%) Xamarin
8 4 (2.02%) Citrix
8 4 (2.02%) Dell
8 4 (2.02%) Intapp
8 4 (2.02%) Kaseya
8 4 (2.02%) Remedy
8 4 (2.02%) SAP
8 4 (2.02%) WatchGuard
9 3 (1.52%) Apple