Hybrid/Remote BPSS Clearance Job Trends

Baseline Personnel Security Standard (BPSS) Clearance
UK > Work from Home

The table below provides summary statistics for remote or hybrid work with a requirement for BPSS Clearance qualifications. It includes a benchmarking guide to the salaries offered over the 6 months leading up to 20 November 2025, comparing them to the same period in the previous two years.

6 months to
20 Nov 2025
Same period 2024 Same period 2023
Rank 240 312 297
Rank change year-on-year +72 -15 +350
Permanent jobs citing BPSS Clearance 146 148 225
As % of all permanent jobs with remote/hybrid work options 0.95% 0.75% 1.06%
As % of the Qualifications category 2.70% 2.87% 3.76%
Number of salaries quoted 81 91 168
10th Percentile £35,854 £48,750 £24,000
25th Percentile £40,312 £53,125 £36,067
Median annual salary (50th Percentile) £57,528 £62,500 £50,000
Median % change year-on-year -7.96% +25.00% -23.08%
75th Percentile £77,500 £71,250 £70,000
90th Percentile £81,250 £82,500 £77,875
UK median annual salary £55,000 £57,750 £57,000
% change year-on-year -4.76% +1.32% -8.80%

All Academic and Professional Certifications
Work from Home

BPSS Clearance falls under the Academic Qualifications and Professional Certifications category. For comparison with the information above, the following table provides summary statistics for all permanent job vacancies with remote or hybrid options requiring academic qualifications or professional certifications.

Permanent vacancies requiring academic qualifications or professional certifications 5,404 5,157 5,989
As % of all permanent jobs with a WFH option 35.33% 26.25% 28.13%
Number of salaries quoted 2,468 2,538 4,406
10th Percentile £29,750 £35,000 £35,226
25th Percentile £41,250 £46,250 £45,250
Median annual salary (50th Percentile) £60,000 £60,000 £60,000
75th Percentile £78,312 £76,250 £76,250
90th Percentile £93,750 £87,500 £92,500
UK median annual salary £55,000 £58,500 £57,500
% change year-on-year -5.98% +1.74% +1.64%

BPSS Clearance
Job Vacancy Trend for Remote/Hybrid Jobs

Historical trend showing the proportion of permanent IT job postings citing BPSS Clearance and offering remote or hybrid work options relative to all permanent IT jobs advertised.
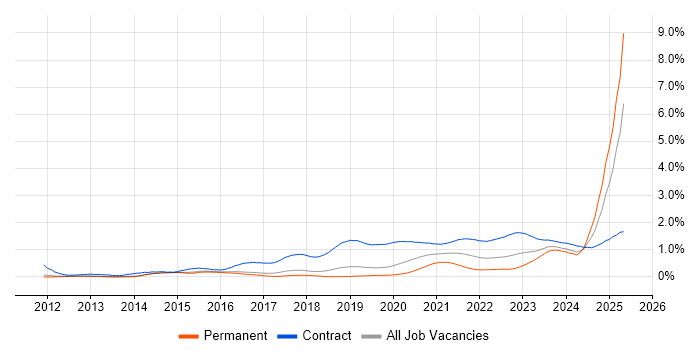
BPSS Clearance job vacancy trend for remote/hybrid jobs

BPSS Clearance
Salary Trend for Remote/Hybrid Jobs

Salary distribution trend for jobs with remote/hybrid work options citing BPSS Clearance.

Salary distribution trend for jobs with remote/hybrid work options citing BPSS Clearance

BPSS Clearance
Salary Histogram for Remote/Hybrid Jobs

Salary distribution for jobs with remote/hybrid work options citing BPSS Clearance over the 6 months to 20 November 2025.

BPSS Clearance salary histogram for jobs with remote/hybrid work options

BPSS Clearance
Co-Occurring Skills & Capabilities in Remote/Hybrid Jobs by Category

The following tables expand on the one above by listing co-occurrences grouped by category. They cover the same employment type, locality and period, with up to 20 co-occurrences shown in each category:

Application Platforms
1 4 (2.74%) Microsoft Exchange
2 3 (2.05%) WordPress
3 2 (1.37%) SharePoint
4 1 (0.68%) Confluence
4 1 (0.68%) SugarCRM
Applications
1 4 (2.74%) Microsoft Office
1 4 (2.74%) Simulink
2 2 (1.37%) Microsoft Excel
3 1 (0.68%) CATIA
3 1 (0.68%) PTC Creo
3 1 (0.68%) Siemens NX
3 1 (0.68%) SOLIDWORKS
3 1 (0.68%) Trello
Business Applications
1 1 (0.68%) Sage 200
1 1 (0.68%) SAP IBP
1 1 (0.68%) SAP S/4HANA
Cloud Services
1 27 (18.49%) Azure
2 23 (15.75%) Entra ID
3 9 (6.16%) Microsoft 365
4 8 (5.48%) Azure Stack
5 7 (4.79%) AWS
6 6 (4.11%) PaaS
7 5 (3.42%) Azure Monitor
7 5 (3.42%) Azure Sentinel
7 5 (3.42%) IaaS
8 4 (2.74%) Google Workspace
9 3 (2.05%) Power Platform
9 3 (2.05%) SaaS
10 2 (1.37%) Azure AI
10 2 (1.37%) Azure AKS
10 2 (1.37%) Azure App Service
10 2 (1.37%) Azure DevOps
10 2 (1.37%) GitHub
11 1 (0.68%) GCP
11 1 (0.68%) Google Tag Manager
11 1 (0.68%) OneDrive
Communications & Networking
1 5 (3.42%) DNS
1 5 (3.42%) Firewall
1 5 (3.42%) VPN
2 3 (2.05%) Internet
3 2 (1.37%) SSH
4 1 (0.68%) SAN
Database & Business Intelligence
1 11 (7.53%) Oracle Reports
2 4 (2.74%) Big Data
2 4 (2.74%) MongoDB
2 4 (2.74%) MySQL
2 4 (2.74%) NoSQL
2 4 (2.74%) SQL Server
3 3 (2.05%) PostgreSQL
3 3 (2.05%) Power BI
4 2 (1.37%) Relational Database
5 1 (0.68%) Amazon Aurora
5 1 (0.68%) Amazon RDS
5 1 (0.68%) Azure SQL Database
5 1 (0.68%) DB2
5 1 (0.68%) Hadoop
5 1 (0.68%) Neo4j
5 1 (0.68%) Power Query
5 1 (0.68%) RDBMS
5 1 (0.68%) SAP HANA
5 1 (0.68%) SQL Server Reporting Services
5 1 (0.68%) Tableau
Development Applications
1 34 (23.29%) Rational DOORS
2 5 (3.42%) Git
3 3 (2.05%) GitLab
3 3 (2.05%) JIRA
4 1 (0.68%) Team Foundation Server
4 1 (0.68%) Visual Studio
General
1 54 (36.99%) Social Skills
2 40 (27.40%) Electronics
3 20 (13.70%) Analytical Skills
4 18 (12.33%) Public Sector
5 15 (10.27%) Aerospace
6 11 (7.53%) Police
7 9 (6.16%) Inclusion and Diversity
8 8 (5.48%) Finance
9 5 (3.42%) Marketing
10 4 (2.74%) Presentation Skills
10 4 (2.74%) Telecoms
11 3 (2.05%) Aeronautics
11 3 (2.05%) Aviation
11 3 (2.05%) Avionics
11 3 (2.05%) Brand Awareness
12 2 (1.37%) Documentation Skills
12 2 (1.37%) Legal
12 2 (1.37%) Manufacturing
13 1 (0.68%) Advertising
13 1 (0.68%) Games
Job Titles
1 35 (23.97%) Systems Engineer
2 34 (23.29%) Principal Engineer
2 34 (23.29%) Principal Systems Engineer
3 24 (16.44%) Analyst
4 12 (8.22%) Support Analyst
5 11 (7.53%) Development Analyst
5 11 (7.53%) Development Support Analyst
5 11 (7.53%) Systems Analyst
5 11 (7.53%) Systems Development Analyst
5 11 (7.53%) Systems Support
5 11 (7.53%) Systems Support Analyst
6 8 (5.48%) Infrastructure Engineer
6 8 (5.48%) IT Engineer
6 8 (5.48%) IT Infrastructure Engineer
7 7 (4.79%) Developer
8 5 (3.42%) Java Developer
9 4 (2.74%) Desktop Engineer
9 4 (2.74%) Integration Manager
9 4 (2.74%) IT Analyst
9 4 (2.74%) Risk Analyst
Libraries, Frameworks & Software Standards
1 11 (7.53%) Oracle Fusion
2 3 (2.05%) .NET
2 3 (2.05%) REST
3 2 (1.37%) CSS
3 2 (1.37%) HTML
3 2 (1.37%) Node.js
4 1 (0.68%) .NET Framework
4 1 (0.68%) ASP.NET
4 1 (0.68%) JSON
4 1 (0.68%) OpenGL
4 1 (0.68%) Pandas
4 1 (0.68%) Playwright
4 1 (0.68%) PySpark
4 1 (0.68%) pytest
4 1 (0.68%) RESTful
4 1 (0.68%) SOAP
4 1 (0.68%) Vulkan
Miscellaneous
1 49 (33.56%) Algorithms
2 16 (10.96%) Management Information System
2 16 (10.96%) Onboarding
3 13 (8.90%) Hybrid Cloud
4 10 (6.85%) Data Centre
5 5 (3.42%) Product Ownership
5 5 (3.42%) Self-Motivation
6 3 (2.05%) Analytical Mindset
6 3 (2.05%) Arduino
6 3 (2.05%) Augmented Reality
6 3 (2.05%) Driving Licence
6 3 (2.05%) IoT
6 3 (2.05%) PKI
6 3 (2.05%) Raspberry Pi
6 3 (2.05%) Virtual Reality
7 2 (1.37%) PMI
8 1 (0.68%) CMDB
8 1 (0.68%) CUDA
8 1 (0.68%) Cyber Threat
8 1 (0.68%) Social Media
Operating Systems
1 17 (11.64%) Windows
2 15 (10.27%) Linux
3 10 (6.85%) Windows Server
3 10 (6.85%) Windows Server 2019
4 8 (5.48%) Rocky
5 4 (2.74%) Windows 10
6 2 (1.37%) Android
6 2 (1.37%) Apple iOS
6 2 (1.37%) Mac OS
Processes & Methodologies
1 49 (33.56%) Systems Engineering
2 43 (29.45%) Technical Leadership
3 41 (28.08%) Signal Processing
4 35 (23.97%) Problem-Solving
5 34 (23.29%) Test Planning
6 26 (17.81%) AI
7 25 (17.12%) Innovative Thinking
8 21 (14.38%) ITIL
9 17 (11.64%) Computer Science
10 16 (10.96%) Analytics
10 16 (10.96%) Project Management
11 14 (9.59%) Agile
11 14 (9.59%) Continuous Improvement
12 13 (8.90%) Change Control
13 11 (7.53%) Customer Requirements
13 11 (7.53%) Data Security
13 11 (7.53%) Knowledge Management
13 11 (7.53%) Mathematics
13 11 (7.53%) Software Engineering
14 10 (6.85%) Validation
Programming Languages
1 23 (15.75%) Python
2 14 (9.59%) Java
3 13 (8.90%) C
4 12 (8.22%) C++
4 12 (8.22%) PowerShell
5 7 (4.79%) JavaScript
5 7 (4.79%) MATLAB
5 7 (4.79%) SQL
6 5 (3.42%) Bicep
7 4 (2.74%) Tcl
8 3 (2.05%) Assembly Language
8 3 (2.05%) Google Apps Script
8 3 (2.05%) Objective-C
8 3 (2.05%) Shell Script
8 3 (2.05%) Swift
9 2 (1.37%) C#
9 2 (1.37%) TypeScript
10 1 (0.68%) GLSL
10 1 (0.68%) PHP
Qualifications
1 74 (50.68%) Security Cleared
2 59 (40.41%) SC Cleared
3 36 (24.66%) Degree
4 13 (8.90%) Azure Certification
4 13 (8.90%) ITIL Foundation Certificate
5 9 (6.16%) Network+ Certification
6 8 (5.48%) DV Cleared
6 8 (5.48%) Master's Degree
6 8 (5.48%) PhD
7 6 (4.11%) Microsoft Certification
8 5 (3.42%) DBS Check
9 3 (2.05%) AWS Certification
9 3 (2.05%) Computer Science Degree
10 2 (1.37%) PMI Certification
10 2 (1.37%) PRINCE2 Practitioner
11 1 (0.68%) A+ Certification
11 1 (0.68%) CISM
11 1 (0.68%) CISSP
11 1 (0.68%) NVQ Level 4
Quality Assurance & Compliance
1 44 (30.14%) ISO/IEC 15288
2 11 (7.53%) Data Quality
3 7 (4.79%) QA
4 4 (2.74%) GDPR
5 1 (0.68%) Cyber Essentials
5 1 (0.68%) Cyber Essentials PLUS
5 1 (0.68%) GRC
5 1 (0.68%) ISO 22301
5 1 (0.68%) ISO/IEC 27001
5 1 (0.68%) NIST
5 1 (0.68%) PMO
5 1 (0.68%) SLA
System Software
1 21 (14.38%) Active Directory
2 13 (8.90%) Hyper-V
3 5 (3.42%) Firmware
3 5 (3.42%) Virtual Machines
3 5 (3.42%) VMware Infrastructure
4 1 (0.68%) Docker
Systems Management
1 10 (6.85%) Kubernetes
2 5 (3.42%) SCOM
2 5 (3.42%) Terraform
3 4 (2.74%) Microsoft Intune
3 4 (2.74%) SCCM
Vendors
1 34 (23.29%) IBM
2 20 (13.70%) Microsoft
3 12 (8.22%) Oracle
4 8 (5.48%) Dell
4 8 (5.48%) Google
5 5 (3.42%) VMware
6 4 (2.74%) HubSpot
7 3 (2.05%) Salesforce
7 3 (2.05%) ServiceNow
8 2 (1.37%) Foundry
8 2 (1.37%) Pega
8 2 (1.37%) Snow
9 1 (0.68%) Atlassian
9 1 (0.68%) Cognos
9 1 (0.68%) Concur
9 1 (0.68%) Mercator
9 1 (0.68%) Sage
9 1 (0.68%) SAP