Public Cloud Jobs with Work from Home Options

Public Cloud
UK > Work from Home

The table below looks at the prevalence of the term Public Cloud in remote or hybrid work. Included is a benchmarking guide to the salaries offered in vacancies that cited Public Cloud over the 6 months leading up to 26 July 2024, comparing them to the same period in the previous two years.

6 months to
26 Jul 2024
Same period 2023 Same period 2022
Rank 199 125 201
Rank change year-on-year -74 +76 -6
Permanent jobs citing Public Cloud 468 871 1,635
As % of all permanent jobs with a WFH option 1.68% 2.65% 2.08%
As % of the Miscellaneous category 4.87% 6.84% 4.46%
Number of salaries quoted 246 593 816
10th Percentile £47,500 £48,750 £46,250
25th Percentile £56,155 £58,750 £57,046
Median annual salary (50th Percentile) £62,783 £75,554 £72,573
Median % change year-on-year -16.90% +4.11% +6.33%
75th Percentile £83,750 £97,328 £97,500
90th Percentile £91,991 £117,236 £110,000
UK median annual salary £65,000 £75,554 £72,500
% change year-on-year -13.97% +4.21% +7.41%

All Generic Skills
Work from Home

Public Cloud falls under the General and Transferable Skills category. For comparison with the information above, the following table provides summary statistics for all permanent job vacancies with remote or hybrid options requiring generic IT skills.

Permanent vacancies with a requirement for generic IT skills 9,605 12,729 36,632
As % of all permanent jobs with a WFH option 34.38% 38.79% 46.65%
Number of salaries quoted 6,855 9,924 18,426
10th Percentile £33,500 £40,000 £37,500
25th Percentile £45,000 £50,000 £47,500
Median annual salary (50th Percentile) £60,000 £65,000 £65,000
Median % change year-on-year -7.69% - +8.33%
75th Percentile £83,750 £85,000 £85,000
90th Percentile £117,500 £107,500 £100,000
UK median annual salary £55,000 £64,000 £62,500
% change year-on-year -14.06% +2.40% +4.17%

Public Cloud
Trend for Jobs with a WFH Option

Job vacancies with a work from home option citing Public Cloud as a proportion of all IT jobs advertised.
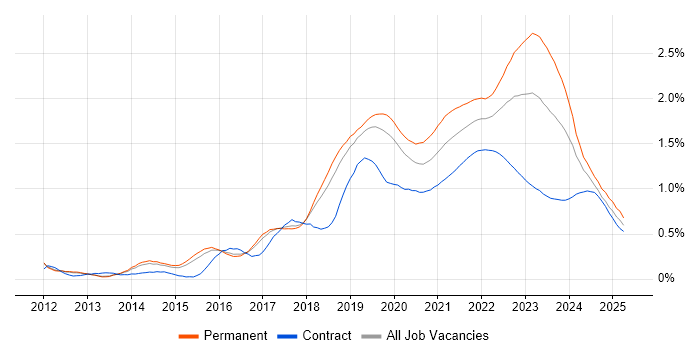
Public Cloud trend for jobs with a WFH option

Public Cloud
Salary Trend for Jobs with a WFH Option

3-month moving average salary quoted in job vacancies with a work from home option citing Public Cloud.

Public Cloud salary trend for jobs with a WFH option

Public Cloud
Salary Histogram for Jobs with a WFH Option

Salary distribution for jobs with a work from home option citing Public Cloud over the 6 months to 26 July 2024.

Public Cloud salary histogram for jobs with a WFH option

Public Cloud
Co-occurring Skills and Capabilities with WFH Options by Category

The follow tables expand on the table above by listing co-occurrences grouped by category. The same employment type, locality and period is covered with up to 20 co-occurrences shown in each of the following categories:

Application Platforms
1 46 (9.83%) WebLogic
2 29 (6.20%) IIS
2 29 (6.20%) Microsoft Exchange
3 28 (5.98%) Apache
3 28 (5.98%) Tomcat
4 19 (4.06%) SharePoint
5 5 (1.07%) Confluence
6 2 (0.43%) BizTalk Server
6 2 (0.43%) Umbraco
7 1 (0.21%) nginx
Applications
1 3 (0.64%) Microsoft Office
2 2 (0.43%) Microsoft Excel
Business Applications
1 46 (9.83%) Sparx Enterprise Architect
2 27 (5.77%) NEC Housing
3 12 (2.56%) Remedy ITSM
4 2 (0.43%) Dynamics CRM
4 2 (0.43%) Dynamics NAV
Cloud Services
1 286 (61.11%) Azure
2 243 (51.92%) AWS
3 140 (29.91%) Microsoft 365
4 136 (29.06%) GCP
5 115 (24.57%) SaaS
6 49 (10.47%) Amazon EKS
7 46 (9.83%) Amazon SQS
8 40 (8.55%) IaaS
9 32 (6.84%) Entra ID
10 28 (5.98%) PaaS
11 13 (2.78%) Kong
12 12 (2.56%) Azure DevOps
12 12 (2.56%) Azure Monitor
12 12 (2.56%) Azure Storage
13 11 (2.35%) Cloud Computing
14 9 (1.92%) GitHub
15 7 (1.50%) AWS KMS
15 7 (1.50%) Azure Key Vault
15 7 (1.50%) Azure Sentinel
16 6 (1.28%) Azure AKS
Communications & Networking
1 95 (20.30%) DNS
2 58 (12.39%) TCP/IP
3 46 (9.83%) BGP
3 46 (9.83%) SSL
4 41 (8.76%) LAN
5 38 (8.12%) WAN
6 36 (7.69%) DHCP
7 34 (7.26%) Firewall
8 31 (6.62%) Wi-Fi
9 22 (4.70%) VPN
10 17 (3.63%) MPLS
10 17 (3.63%) Remote Desktop
11 16 (3.42%) VLAN
12 15 (3.21%) Cisco ISE
13 13 (2.78%) SD-WAN
14 12 (2.56%) Unified Communications
15 10 (2.14%) Network Security
16 7 (1.50%) Broadband
16 7 (1.50%) Wireless
17 6 (1.28%) WLAN
Database & Business Intelligence
1 78 (16.67%) Oracle Database
2 65 (13.89%) Relational Database
3 48 (10.26%) Amazon RDS
4 46 (9.83%) RDBMS
5 41 (8.76%) SQL Server
6 40 (8.55%) NoSQL
7 24 (5.13%) DB2
8 15 (3.21%) MongoDB
9 12 (2.56%) BigQuery
9 12 (2.56%) Data Hub
9 12 (2.56%) Enterprise Data Warehouse
10 5 (1.07%) Elasticsearch
10 5 (1.07%) MySQL
10 5 (1.07%) Redis
11 3 (0.64%) PostgreSQL
12 2 (0.43%) Azure SQL Data Warehouse
12 2 (0.43%) Data Warehouse
12 2 (0.43%) DynamoDB
12 2 (0.43%) SQL Server Integration Services
12 2 (0.43%) SQL Server Reporting Services
Development Applications
1 13 (2.78%) GitLab
2 12 (2.56%) Artifactory
2 12 (2.56%) Git
3 10 (2.14%) Jenkins
4 6 (1.28%) JIRA
5 5 (1.07%) Oracle Forms
6 2 (0.43%) CircleCI
6 2 (0.43%) Maven
7 1 (0.21%) Gradle
7 1 (0.21%) IBM UrbanCode
7 1 (0.21%) Mockito
7 1 (0.21%) Sonatype Nexus
7 1 (0.21%) Spinnaker
7 1 (0.21%) Vagrant
General
1 129 (27.56%) Social Skills
2 99 (21.15%) Public Sector
3 85 (18.16%) Presentation Skills
4 71 (15.17%) Finance
5 31 (6.62%) Analytical Skills
6 28 (5.98%) Police
7 27 (5.77%) Local Government
8 20 (4.27%) Banking
9 17 (3.63%) Legal
10 13 (2.78%) Financial Institution
10 13 (2.78%) Inclusion and Diversity
10 13 (2.78%) Law
11 11 (2.35%) Retail
12 7 (1.50%) Organisational Skills
13 6 (1.28%) Back Office
14 3 (0.64%) Marketing
15 2 (0.43%) Advertising
15 2 (0.43%) Pharmaceutical
15 2 (0.43%) Telecoms
16 1 (0.21%) Front Office
Job Titles
1 242 (51.71%) Architect
2 129 (27.56%) Solutions Architect
3 101 (21.58%) Senior
4 92 (19.66%) Cloud Architect
5 83 (17.74%) Lead
6 73 (15.60%) Lead Architect
7 58 (12.39%) Lead Solutions Architect
8 45 (9.62%) Senior Architect
8 45 (9.62%) Senior Solutions Architect
9 39 (8.33%) Infrastructure Engineer
10 33 (7.05%) Cloud Engineer
11 32 (6.84%) Senior Infrastructure Engineer
12 28 (5.98%) Applications Support
13 16 (3.42%) Cloud Infrastructure Engineer
13 16 (3.42%) Project Manager
14 15 (3.21%) Azure Engineer
15 14 (2.99%) Consultant
15 14 (2.99%) Site Reliability Engineer
16 13 (2.78%) Technical Consultant
16 13 (2.78%) WAN Engineer
Libraries, Frameworks & Software Standards
1 51 (10.90%) Spring Boot
2 46 (9.83%) RabbitMQ
3 29 (6.20%) Web Services
4 18 (3.85%) Middleware
5 13 (2.78%) .NET
6 8 (1.71%) Kafka
7 7 (1.50%) AngularJS
7 7 (1.50%) React
7 7 (1.50%) Spring
8 6 (1.28%) Node.js
9 4 (0.85%) .NET Framework
9 4 (0.85%) CSS
9 4 (0.85%) Entity Framework
9 4 (0.85%) HTML
9 4 (0.85%) J2EE
9 4 (0.85%) Oracle ADF
9 4 (0.85%) YAML
10 3 (0.64%) SailPoint
11 2 (0.43%) ARM Templates
11 2 (0.43%) Vue
Miscellaneous
1 88 (18.80%) PKI
2 65 (13.89%) Enterprise Software
3 52 (11.11%) Data Centre
4 35 (7.48%) Hybrid Cloud
5 12 (2.56%) Cyberattack
5 12 (2.56%) Data Fabric
5 12 (2.56%) Linux Command Line
6 11 (2.35%) Cloud Native
6 11 (2.35%) Management Information System
7 7 (1.50%) Self-Motivation
8 6 (1.28%) Onboarding
9 5 (1.07%) Culture of Ownership
10 4 (0.85%) Cyber Kill Chain
10 4 (0.85%) Cyber Threat
11 3 (0.64%) Housing Association
12 2 (0.43%) EMC VNX
12 2 (0.43%) IoT
12 2 (0.43%) Security Posture
13 1 (0.21%) Data Structures
13 1 (0.21%) Private Cloud
Operating Systems
1 135 (28.85%) Linux
2 117 (25.00%) Windows
3 46 (9.83%) Red Hat Enterprise Linux
4 44 (9.40%) Unix
5 31 (6.62%) Solaris
6 16 (3.42%) zOS
7 9 (1.92%) Windows Server
8 5 (1.07%) Windows Server 2019
9 4 (0.85%) CentOS
9 4 (0.85%) Ubuntu
10 2 (0.43%) Mac OS
10 2 (0.43%) Windows Server 2016
11 1 (0.21%) Data ONTAP
11 1 (0.21%) VMS
11 1 (0.21%) Windows Server 2012
Processes & Methodologies
1 170 (36.32%) Agile
2 153 (32.69%) Migration
3 149 (31.84%) Project Management
4 146 (31.20%) TOGAF
5 129 (27.56%) Mentoring
6 127 (27.14%) Actionable Insight
7 125 (26.71%) Coaching
8 114 (24.36%) Presales
9 94 (20.09%) Microservices
10 87 (18.59%) Configuration Management
11 82 (17.52%) Design Patterns
12 81 (17.31%) Application Virtualisation
13 80 (17.09%) Open Source
14 77 (16.45%) Architectural Patterns
15 71 (15.17%) DevOps
16 66 (14.10%) Scrum
17 62 (13.25%) Roadmaps
18 60 (12.82%) Infrastructure as Code
19 58 (12.39%) Infrastructure Engineering
20 53 (11.32%) SDLC
Programming Languages
1 54 (11.54%) SQL
2 30 (6.41%) Shell Script
3 28 (5.98%) PowerShell
4 20 (4.27%) Python
5 18 (3.85%) Bash
6 16 (3.42%) Java
7 13 (2.78%) C#
8 12 (2.56%) JavaScript
9 4 (0.85%) Go
9 4 (0.85%) PL/SQL
10 3 (0.64%) AWK
10 3 (0.64%) sed
10 3 (0.64%) TypeScript
11 1 (0.21%) Bicep
11 1 (0.21%) Groovy
11 1 (0.21%) PHP
11 1 (0.21%) Scala
Qualifications
1 97 (20.73%) Security Cleared
2 72 (15.38%) Azure Certification
3 66 (14.10%) Degree
4 56 (11.97%) SC Cleared
5 55 (11.75%) AWS Certification
6 48 (10.26%) AWS Certified Solutions Architect
7 16 (3.42%) APMP
7 16 (3.42%) TOGAF Certification
8 12 (2.56%) Microsoft Certification
9 10 (2.14%) CISSP
10 9 (1.92%) Computer Science Degree
11 6 (1.28%) BPSS Clearance
11 6 (1.28%) Cisco Certification
12 5 (1.07%) CCNA
13 4 (0.85%) CISM
13 4 (0.85%) MCSE
14 3 (0.64%) CCNP
14 3 (0.64%) ITIL Certification
14 3 (0.64%) PhD
14 3 (0.64%) VMware Certified Professional (VCP)
Quality Assurance & Compliance
1 27 (5.77%) Accessibility
2 6 (1.28%) ISO/IEC 27001
3 5 (1.07%) NIST
4 4 (0.85%) ISO/IEC 27002 (supersedes ISO/IEC 17799)
4 4 (0.85%) NCSC
5 2 (0.43%) PCI DSS
5 2 (0.43%) SLA
6 1 (0.21%) Data Quality
6 1 (0.21%) GDPR
6 1 (0.21%) Government Security Classifications
6 1 (0.21%) HIPAA
6 1 (0.21%) ISO 22301
6 1 (0.21%) ISO 9001
6 1 (0.21%) QA
System Software
1 72 (15.38%) Active Directory
2 30 (6.41%) VMware Infrastructure
3 28 (5.98%) Hyper-V
4 23 (4.91%) VMware ESXi
5 18 (3.85%) Docker
6 2 (0.43%) vSphere
6 2 (0.43%) XenDesktop
7 1 (0.21%) vCloud
7 1 (0.21%) Virtual Desktop
7 1 (0.21%) Virtual Servers
7 1 (0.21%) VMware NSX
Systems Management
1 43 (9.19%) Terraform
2 32 (6.84%) Ansible
3 25 (5.34%) Kubernetes
4 16 (3.42%) WSUS
5 15 (3.21%) Microsoft Intune
6 8 (1.71%) Single Sign-On
7 7 (1.50%) CA Single Sign-On
7 7 (1.50%) Grafana
8 6 (1.28%) SCOM
9 5 (1.07%) Prometheus
10 4 (0.85%) vCenter Server
11 3 (0.64%) Active Directory Federation Services
11 3 (0.64%) Nagios
11 3 (0.64%) Puppet
11 3 (0.64%) SCCM
12 2 (0.43%) EMC NetWorker
12 2 (0.43%) Istio
12 2 (0.43%) Packer
12 2 (0.43%) Progress Chef
13 1 (0.21%) Salt
Vendors
1 215 (45.94%) Microsoft
2 113 (24.15%) Oracle
3 104 (22.22%) Google
4 46 (9.83%) Sparx
5 39 (8.33%) Cisco
6 32 (6.84%) VMware
7 27 (5.77%) NEC
8 23 (4.91%) BMC
9 21 (4.49%) Meraki
10 19 (4.06%) Aruba
11 17 (3.63%) Fortinet
12 16 (3.42%) Ruckus Wireless
13 15 (3.21%) F5
14 13 (2.78%) Adobe
14 13 (2.78%) IBM
15 12 (2.56%) Apple
15 12 (2.56%) Databricks
15 12 (2.56%) Remedy
15 12 (2.56%) Salesforce
16 11 (2.35%) ServiceNow