Technical Leadership Jobs with Hybrid/Remote/WFH Options

Technical Leadership
UK > Work from Home

The table below provides summary statistics for permanent remote or hybrid work requiring Technical Leadership skills. It includes a benchmarking guide to the annual salaries offered in vacancies that cited Technical Leadership over the 6 months leading up to 9 May 2025, comparing them to the same period in the previous two years.

6 months to
9 May 2025
Same period 2024 Same period 2023
Rank 91 167 170
Rank change year-on-year +76 +3 +67
Permanent jobs citing Technical Leadership 590 678 879
As % of all permanent jobs with a WFH option 3.55% 2.01% 2.12%
As % of the Processes & Methodologies category 3.79% 2.20% 2.21%
Number of salaries quoted 516 577 581
10th Percentile £54,793 £53,750 £52,500
25th Percentile £67,500 £61,250 £62,500
Median annual salary (50th Percentile) £70,600 £74,137 £80,000
Median % change year-on-year -4.77% -7.33% +6.67%
75th Percentile £80,000 £90,000 £92,500
90th Percentile £98,474 £110,000 £108,365
UK median annual salary £70,600 £72,500 £80,000
% change year-on-year -2.62% -9.38% +6.67%

All Process and Methodology Skills
Work from Home

Technical Leadership falls under the Processes and Methodologies category. For comparison with the information above, the following table provides summary statistics for all permanent job vacancies with remote or hybrid options requiring process or methodology skills.

Permanent vacancies with a requirement for process or methodology skills 15,587 30,857 39,858
As % of all permanent jobs with a WFH option 93.80% 91.38% 96.11%
Number of salaries quoted 9,824 23,439 27,686
10th Percentile £29,750 £33,750 £37,500
25th Percentile £44,000 £42,500 £47,500
Median annual salary (50th Percentile) £60,000 £57,500 £62,500
Median % change year-on-year +4.35% -8.00% +4.17%
75th Percentile £77,500 £75,000 £82,500
90th Percentile £102,500 £95,000 £100,000
UK median annual salary £57,500 £55,000 £61,180
% change year-on-year +4.55% -10.10% +1.97%

Technical Leadership
Trend for Jobs with a WFH Option

Job vacancies with remote working options citing Technical Leadership as a proportion of all IT jobs advertised.
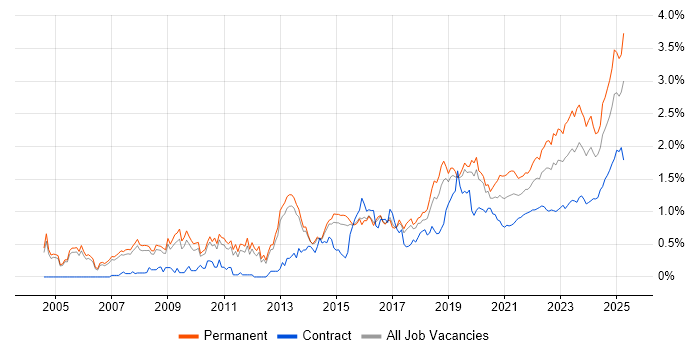
Technical Leadership trend for jobs with Hybrid/Remote/WFH options

Technical Leadership
Salary Trend for Jobs with a WFH Option

3-month moving average salary quoted in job vacancies with remote working options citing Technical Leadership.

Technical Leadership salary trend for jobs with a WFH option

Technical Leadership
Salary Histogram for Jobs with a WFH Option

Salary distribution for jobs with remote working options citing Technical Leadership over the 6 months to 9 May 2025.

Technical Leadership salary histogram for jobs with a WFH option

Technical Leadership
Co-occurring Skills and Capabilities with WFH Options by Category

The follow tables expand on the table above by listing co-occurrences grouped by category. The same employment type, locality and period is covered with up to 20 co-occurrences shown in each of the following categories:

Application Platforms
1 8 (1.36%) Apache Airflow
2 7 (1.19%) Tomcat
3 5 (0.85%) Apache Spark
3 5 (0.85%) NetWeaver
3 5 (0.85%) SharePoint
4 4 (0.68%) Confluence
4 4 (0.68%) Microsoft Exchange
5 3 (0.51%) IIS
6 2 (0.34%) Apache
6 2 (0.34%) Oracle Workflow
6 2 (0.34%) WebSphere
6 2 (0.34%) WebSphere Application Server
7 1 (0.17%) Drupal
7 1 (0.17%) nginx
7 1 (0.17%) Skype for Business
Applications
1 50 (8.47%) Microsoft Office
2 41 (6.95%) Simulink
3 4 (0.68%) Microsoft Project
4 2 (0.34%) Trello
5 1 (0.17%) Chatbot
Business Applications
1 12 (2.03%) Dynamics CRM
2 5 (0.85%) Oracle Subledger Accounting
3 3 (0.51%) Oracle EBS
4 2 (0.34%) Magento
4 2 (0.34%) Oracle EBS R12
4 2 (0.34%) Oracle ERP
4 2 (0.34%) PeopleSoft HCM
4 2 (0.34%) SAP S/4HANA
4 2 (0.34%) Shopify
5 1 (0.17%) BASE24
5 1 (0.17%) Oracle Financials
5 1 (0.17%) Oracle Procure-to-Pay
5 1 (0.17%) SAP ERP
Cloud Services
1 128 (21.69%) Azure
2 95 (16.10%) AWS
3 40 (6.78%) Azure DevOps
4 38 (6.44%) GCP
5 29 (4.92%) Serverless
6 27 (4.58%) Azure Service Bus
7 25 (4.24%) Azure Cosmos DB
8 24 (4.07%) AWS Lambda
8 24 (4.07%) SonarCloud
9 22 (3.73%) GitHub
9 22 (3.73%) Power Platform
10 21 (3.56%) SaaS
11 18 (3.05%) AWS CloudFormation
12 14 (2.37%) Dynamics 365
13 13 (2.20%) AWS KMS
14 11 (1.86%) Microsoft 365
15 10 (1.69%) Power Automate
16 9 (1.53%) Azure Logic Apps
16 9 (1.53%) GitHub Actions
16 9 (1.53%) IaaS
Communications & Networking
1 18 (3.05%) Network Security
2 16 (2.71%) Firewall
3 10 (1.69%) WAN
4 8 (1.36%) BGP
4 8 (1.36%) DNS
4 8 (1.36%) LAN
4 8 (1.36%) VPN
5 7 (1.19%) DHCP
6 6 (1.02%) VLAN
7 5 (0.85%) Multicast
7 5 (0.85%) SAN
8 4 (0.68%) Cisco IOS
8 4 (0.68%) HSRP
8 4 (0.68%) IPsec
8 4 (0.68%) Junos
8 4 (0.68%) MPLS
9 3 (0.51%) Fibre Channel
9 3 (0.51%) iSCSI
9 3 (0.51%) NAS
9 3 (0.51%) TCP/IP
Database & Business Intelligence
1 35 (5.93%) SQL Server
2 29 (4.92%) Elasticsearch
3 22 (3.73%) Data Lake
4 16 (2.71%) Data Warehouse
5 14 (2.37%) Big Data
6 12 (2.03%) NoSQL
7 10 (1.69%) MongoDB
8 9 (1.53%) MySQL
8 9 (1.53%) SAP HANA
9 7 (1.19%) PostgreSQL
9 7 (1.19%) Power BI
10 6 (1.02%) Hadoop
11 5 (0.85%) BusinessObjects
11 5 (0.85%) Relational Database
11 5 (0.85%) SAP BW
11 5 (0.85%) SAP Data Services
12 4 (0.68%) Amazon Athena
12 4 (0.68%) Amazon RDS
12 4 (0.68%) Azure SQL Database
12 4 (0.68%) RDBMS
Development Applications
1 172 (29.15%) Rational DOORS
2 58 (9.83%) Git
3 27 (4.58%) Jenkins
4 26 (4.41%) Octopus Deploy
4 26 (4.41%) Team Foundation Server
4 26 (4.41%) Visual Studio
5 24 (4.07%) MSBuild
6 16 (2.71%) JIRA
7 13 (2.20%) GitLab
8 9 (1.53%) SonarQube
9 7 (1.19%) Gradle
10 6 (1.02%) Oracle Forms
11 3 (0.51%) Postman
11 3 (0.51%) Selenium
11 3 (0.51%) Xcode
11 3 (0.51%) XCTest
11 3 (0.51%) XCUITest
12 2 (0.34%) Jasmine
12 2 (0.34%) Karma Test Runner
12 2 (0.34%) Sonatype Nexus
General
1 220 (37.29%) Electronics
2 161 (27.29%) Social Skills
3 91 (15.42%) Finance
4 50 (8.47%) Banking
5 48 (8.14%) Aerospace
6 36 (6.10%) Analytical Skills
7 31 (5.25%) Retail
8 23 (3.90%) Games
9 22 (3.73%) Inclusion and Diversity
10 21 (3.56%) Public Sector
11 6 (1.02%) Advertising
12 5 (0.85%) General Ledger
12 5 (0.85%) Manufacturing
12 5 (0.85%) Telecoms
13 4 (0.68%) Documentation Skills
13 4 (0.68%) Marketing
14 3 (0.51%) Billing
14 3 (0.51%) Legal
15 2 (0.34%) Automotive
15 2 (0.34%) Military
Job Titles
1 212 (35.93%) Systems Engineer
2 180 (30.51%) Principal Engineer
3 172 (29.15%) Principal Systems Engineer
4 148 (25.08%) Lead
5 107 (18.14%) Architect
6 106 (17.97%) Senior
7 54 (9.15%) Team Leader
8 40 (6.78%) Lead Systems Engineer
8 40 (6.78%) Senior Systems Engineer
9 39 (6.61%) Technical Architect
10 38 (6.44%) Solutions Architect
11 37 (6.27%) Developer
12 29 (4.92%) Software Engineer
13 21 (3.56%) Technical Leader
14 17 (2.88%) Cloud Architect
15 16 (2.71%) Lead Developer
16 14 (2.37%) Engineering Manager
16 14 (2.37%) Senior Manager
16 14 (2.37%) Senior Software Engineer
16 14 (2.37%) Software Engineering Manager
Libraries, Frameworks & Software Standards
1 63 (10.68%) .NET
2 38 (6.44%) CSS
2 38 (6.44%) React
3 37 (6.27%) HTML
4 34 (5.76%) AngularJS
4 34 (5.76%) Kafka
5 29 (4.92%) REST
6 28 (4.75%) JSON
6 28 (4.75%) XML
7 25 (4.24%) ASP.NET
7 25 (4.24%) Bootstrap
8 24 (4.07%) gRPC
9 18 (3.05%) Node.js
10 16 (2.71%) RESTful
11 14 (2.37%) .NET Core
12 13 (2.20%) Elastic Stack
13 12 (2.03%) .NET Framework
14 10 (1.69%) Laravel
14 10 (1.69%) Web Services
15 8 (1.36%) Middleware
Miscellaneous
1 215 (36.44%) Algorithms
2 31 (5.25%) Management Information System
3 26 (4.41%) Cloud Native
4 25 (4.24%) Product Ownership
5 18 (3.05%) Data Centre
6 12 (2.03%) Mobile App
7 11 (1.86%) Legacy Systems
8 9 (1.53%) Onboarding
9 8 (1.36%) Greenfield Project
9 8 (1.36%) Private Cloud
10 7 (1.19%) Client/Server
10 7 (1.19%) Mobile Games
10 7 (1.19%) Public Cloud
11 6 (1.02%) Clustering
11 6 (1.02%) Enterprise Software
11 6 (1.02%) Hybrid Cloud
12 4 (0.68%) Data Protection Act
12 4 (0.68%) Data Structures
13 3 (0.51%) Derivative
13 3 (0.51%) Life Science
Operating Systems
1 27 (4.58%) Linux
2 20 (3.39%) Windows
3 17 (2.88%) Apple iOS
4 14 (2.37%) Windows Server
5 12 (2.03%) Android
6 8 (1.36%) Red Hat Enterprise Linux
7 5 (0.85%) AIX
7 5 (0.85%) Unix
8 3 (0.51%) CentOS
8 3 (0.51%) Windows Server 2016
9 2 (0.34%) Debian
9 2 (0.34%) Solaris
10 1 (0.17%) Amazon Linux
10 1 (0.17%) Windows Server 2003
10 1 (0.17%) Windows Server 2019
Processes & Methodologies
1 244 (41.36%) Systems Engineering
2 200 (33.90%) Signal Processing
3 192 (32.54%) Agile
4 172 (29.15%) Test Planning
5 161 (27.29%) Mentoring
6 138 (23.39%) DevOps
7 135 (22.88%) Software Engineering
8 97 (16.44%) Microservices
9 92 (15.59%) Problem-Solving
10 90 (15.25%) Coaching
11 84 (14.24%) CI/CD
12 64 (10.85%) Continuous Improvement
13 61 (10.34%) Design Patterns
13 61 (10.34%) Project Management
14 53 (8.98%) Architectural Design
14 53 (8.98%) Roadmaps
15 52 (8.81%) Computer Science
16 48 (8.14%) Stakeholder Management
17 45 (7.63%) Line Management
18 42 (7.12%) Software Delivery
Programming Languages
1 89 (15.08%) JavaScript
2 77 (13.05%) Java
3 75 (12.71%) C#
4 65 (11.02%) SQL
5 44 (7.46%) Python
6 39 (6.61%) TypeScript
7 21 (3.56%) C++
8 19 (3.22%) PHP
9 16 (2.71%) C
10 10 (1.69%) Kotlin
10 10 (1.69%) Swift
11 7 (1.19%) Objective-C
11 7 (1.19%) PowerShell
12 5 (0.85%) Ruby
13 3 (0.51%) MATLAB
13 3 (0.51%) Scala
13 3 (0.51%) T-SQL
14 2 (0.34%) VB.NET
15 1 (0.17%) Perl
15 1 (0.17%) PL/SQL
Qualifications
1 248 (42.03%) BPSS Clearance
2 75 (12.71%) Degree
3 56 (9.49%) Security Cleared
4 49 (8.31%) SC Cleared
5 33 (5.59%) Computer Science Degree
6 19 (3.22%) AWS Certification
7 16 (2.71%) AWS Certified Solutions Architect
8 13 (2.20%) CCNP
8 13 (2.20%) Cisco Certification
9 11 (1.86%) Master's Degree
10 7 (1.19%) Azure Certification
11 6 (1.02%) DBS Check
11 6 (1.02%) SAP Certification
12 5 (0.85%) CCNA
12 5 (0.85%) PhD
12 5 (0.85%) PMI Certification
12 5 (0.85%) PMP
12 5 (0.85%) TOGAF Certification
13 4 (0.68%) DV Cleared
13 4 (0.68%) JNCIS
Quality Assurance & Compliance
1 204 (34.58%) ISO/IEC 15288
2 44 (7.46%) QA
3 42 (7.12%) GDPR
4 17 (2.88%) HIPAA
5 11 (1.86%) Data Quality
6 9 (1.53%) SLA
7 6 (1.02%) ISO/IEC 27001
8 4 (0.68%) Accessibility
8 4 (0.68%) SOC 2
9 3 (0.51%) PMBOK
10 1 (0.17%) AUTOSAR
10 1 (0.17%) ECSS
10 1 (0.17%) ISO 26262
10 1 (0.17%) MISRA
10 1 (0.17%) MISRA C
10 1 (0.17%) NCSC
10 1 (0.17%) PCI DSS
10 1 (0.17%) PMO
System Software
1 69 (11.69%) Docker
2 12 (2.03%) Active Directory
3 11 (1.86%) VMware Infrastructure
4 5 (0.85%) VMware ESXi
5 4 (0.68%) Hyper-V
6 2 (0.34%) KVM
6 2 (0.34%) NFS
6 2 (0.34%) SRDF
6 2 (0.34%) Veritas Cluster Server
6 2 (0.34%) VMware NSX
6 2 (0.34%) vSphere
6 2 (0.34%) Xen
7 1 (0.17%) BitLocker
7 1 (0.17%) Firmware
7 1 (0.17%) VMware Server
Systems Management
1 53 (8.98%) Kubernetes
2 47 (7.97%) Terraform
3 16 (2.71%) Prometheus
4 15 (2.54%) Grafana
5 11 (1.86%) Ansible
6 5 (0.85%) Tivoli Storage Manager
7 4 (0.68%) Microsoft Intune
7 4 (0.68%) Puppet
8 3 (0.51%) Active Directory Federation Services
8 3 (0.51%) SCCM
9 2 (0.34%) Marathon
9 2 (0.34%) Progress Chef
9 2 (0.34%) Single Sign-On
9 2 (0.34%) vCenter Server
10 1 (0.17%) FortiGate
10 1 (0.17%) SCOM
10 1 (0.17%) SCOrch
10 1 (0.17%) SCSM
10 1 (0.17%) ZABBIX
Vendors
1 177 (30.00%) IBM
2 115 (19.49%) Microsoft
3 40 (6.78%) MathWorks
4 22 (3.73%) Databricks
5 19 (3.22%) Google
6 17 (2.88%) Oracle
7 14 (2.37%) SAP
7 14 (2.37%) VMware
8 13 (2.20%) Cisco
9 7 (1.19%) New Relic
10 5 (0.85%) ServiceNow
11 4 (0.68%) Juniper
11 4 (0.68%) Teradata
12 3 (0.51%) Guidewire
12 3 (0.51%) Mitel
12 3 (0.51%) Salesforce
13 2 (0.34%) Cloudera
13 2 (0.34%) F5
13 2 (0.34%) Hyperion
13 2 (0.34%) NetApp