Hybrid Cloud Jobs with Work from Home Options

Hybrid Cloud
UK > Work from Home

The table below looks at the prevalence of the term Hybrid Cloud in remote or hybrid work. Included is a benchmarking guide to the salaries offered in vacancies that cited Hybrid Cloud over the 6 months leading up to 26 July 2024, comparing them to the same period in the previous two years.

6 months to
26 Jul 2024
Same period 2023 Same period 2022
Rank 404 244 550
Rank change year-on-year -160 +306 -237
Permanent jobs citing Hybrid Cloud 131 441 400
As % of all permanent jobs with a WFH option 0.47% 1.34% 0.51%
As % of the Miscellaneous category 1.36% 3.46% 1.09%
Number of salaries quoted 68 334 248
10th Percentile £42,238 £52,500 £41,250
25th Percentile £46,250 - £57,500
Median annual salary (50th Percentile) £62,783 £70,000 £74,589
Median % change year-on-year -10.31% -6.15% +14.75%
75th Percentile £74,256 £72,432 £95,000
90th Percentile £98,325 £101,125 £106,987
UK median annual salary £70,000 £70,000 £70,000
% change year-on-year - - +6.06%

All Generic Skills
Work from Home

Hybrid Cloud falls under the General and Transferable Skills category. For comparison with the information above, the following table provides summary statistics for all permanent job vacancies with remote or hybrid options requiring generic IT skills.

Permanent vacancies with a requirement for generic IT skills 9,605 12,729 36,632
As % of all permanent jobs with a WFH option 34.38% 38.79% 46.65%
Number of salaries quoted 6,855 9,924 18,426
10th Percentile £33,500 £40,000 £37,500
25th Percentile £45,000 £50,000 £47,500
Median annual salary (50th Percentile) £60,000 £65,000 £65,000
Median % change year-on-year -7.69% - +8.33%
75th Percentile £83,750 £85,000 £85,000
90th Percentile £117,500 £107,500 £100,000
UK median annual salary £55,000 £64,000 £62,500
% change year-on-year -14.06% +2.40% +4.17%

Hybrid Cloud
Trend for Jobs with a WFH Option

Job vacancies with a work from home option citing Hybrid Cloud as a proportion of all IT jobs advertised.
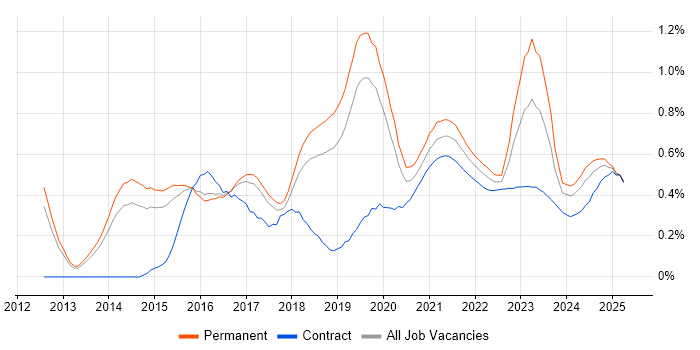
Hybrid Cloud trend for jobs with a WFH option

Hybrid Cloud
Salary Trend for Jobs with a WFH Option

3-month moving average salary quoted in job vacancies with a work from home option citing Hybrid Cloud.

Hybrid Cloud salary trend for jobs with a WFH option

Hybrid Cloud
Salary Histogram for Jobs with a WFH Option

Salary distribution for jobs with a work from home option citing Hybrid Cloud over the 6 months to 26 July 2024.

Hybrid Cloud salary histogram for jobs with a WFH option

Hybrid Cloud
Co-occurring Skills and Capabilities with WFH Options by Category

The follow tables expand on the table above by listing co-occurrences grouped by category. The same employment type, locality and period is covered with up to 20 co-occurrences shown in each of the following categories:

Application Platforms
1 5 (3.82%) Apache Airflow
1 5 (3.82%) Confluence
2 3 (2.29%) Oracle Workflow
3 2 (1.53%) IIS
3 2 (1.53%) Microsoft Exchange
3 2 (1.53%) SharePoint
Applications
1 2 (1.53%) Microsoft Excel
2 1 (0.76%) Microsoft Office
Cloud Services
1 70 (53.44%) Azure
2 54 (41.22%) AWS
3 24 (18.32%) GCP
4 17 (12.98%) Entra ID
5 13 (9.92%) Microsoft 365
6 11 (8.40%) SaaS
7 10 (7.63%) Nutanix
8 8 (6.11%) Cloud Computing
9 7 (5.34%) AWS KMS
9 7 (5.34%) Azure Key Vault
9 7 (5.34%) Power Platform
10 5 (3.82%) AWS CloudFormation
10 5 (3.82%) Cloud Composer
10 5 (3.82%) dbt
10 5 (3.82%) Google Kubernetes Engine
11 4 (3.05%) Azure Data Factory
11 4 (3.05%) Azure DevOps
11 4 (3.05%) IaaS
11 4 (3.05%) PaaS
11 4 (3.05%) Serverless
Communications & Networking
1 24 (18.32%) DNS
2 23 (17.56%) Firewall
3 15 (11.45%) VLAN
4 12 (9.16%) BGP
4 12 (9.16%) LAN
4 12 (9.16%) WAN
5 11 (8.40%) OSPF
5 11 (8.40%) VPN
6 9 (6.87%) TCP/IP
7 8 (6.11%) Network Security
7 8 (6.11%) Wireless
8 6 (4.58%) NGFW
9 5 (3.82%) 5G
9 5 (3.82%) Broadband
10 4 (3.05%) Intrusion Detection
10 4 (3.05%) IPsec
10 4 (3.05%) SSL
11 3 (2.29%) Cisco ASA
11 3 (2.29%) DMVPN
11 3 (2.29%) EIGRP
Database & Business Intelligence
1 10 (7.63%) Amazon RDS
2 7 (5.34%) BigQuery
3 5 (3.82%) Looker
3 5 (3.82%) Power BI
3 5 (3.82%) Tableau
4 4 (3.05%) NoSQL
5 3 (2.29%) Azure SQL Database
5 3 (2.29%) SQL Server
6 1 (0.76%) PostgreSQL
Development Applications
1 17 (12.98%) GitLab
2 12 (9.16%) Artifactory
3 8 (6.11%) JIRA
4 6 (4.58%) Git
5 1 (0.76%) Bitbucket
5 1 (0.76%) Jenkins
5 1 (0.76%) Subversion
General
1 39 (29.77%) Public Sector
2 33 (25.19%) Inclusion and Diversity
3 20 (15.27%) Finance
4 19 (14.50%) Organisational Skills
5 15 (11.45%) Social Skills
6 9 (6.87%) Retail
7 8 (6.11%) Back Office
8 7 (5.34%) Legal
9 5 (3.82%) Presentation Skills
10 4 (3.05%) Analytical Skills
10 4 (3.05%) Manufacturing
11 3 (2.29%) Banking
11 3 (2.29%) Financial Institution
11 3 (2.29%) Law
11 3 (2.29%) Local Government
11 3 (2.29%) Marketing
11 3 (2.29%) Publishing
12 2 (1.53%) Public Speaking
13 1 (0.76%) Telecoms
Job Titles
1 39 (29.77%) Infrastructure Engineer
2 31 (23.66%) Architect
3 28 (21.37%) Senior
4 20 (15.27%) Cloud Engineer
5 19 (14.50%) Senior Infrastructure Engineer
6 15 (11.45%) Cloud Infrastructure Engineer
7 14 (10.69%) Senior Cloud Engineer
8 13 (9.92%) Lead
9 11 (8.40%) Security Engineer
10 10 (7.63%) Virtualisation Engineer
10 10 (7.63%) Wintel Engineer
10 10 (7.63%) Wintel Infrastructure Engineer
11 8 (6.11%) DevOps Engineer
11 8 (6.11%) Product Manager
12 7 (5.34%) Head of Engineering
12 7 (5.34%) Infrastructure Security Engineer
12 7 (5.34%) Senior Manager
12 7 (5.34%) Senior Product Manager
12 7 (5.34%) Senior Security Engineer
13 6 (4.58%) Systems Engineer
Libraries, Frameworks & Software Standards
1 10 (7.63%) REST
2 6 (4.58%) OAuth
2 6 (4.58%) OpenID
2 6 (4.58%) SAML
3 3 (2.29%) 802.1X
3 3 (2.29%) LDAP
3 3 (2.29%) RESTful
3 3 (2.29%) SailPoint
3 3 (2.29%) Web Services
3 3 (2.29%) XMPP
4 2 (1.53%) .NET
4 2 (1.53%) PySpark
5 1 (0.76%) ARM Templates
5 1 (0.76%) Middleware
Miscellaneous
1 35 (26.72%) Data Centre
1 35 (26.72%) Public Cloud
2 18 (13.74%) Cloud Native
3 11 (8.40%) Enterprise Software
3 11 (8.40%) PKI
4 10 (7.63%) Clustering
4 10 (7.63%) Enterprise Cloud
5 7 (5.34%) Onboarding
5 7 (5.34%) Self-Motivation
6 6 (4.58%) Distributed Systems
7 5 (3.82%) Culture of Ownership
7 5 (3.82%) Linux Command Line
7 5 (3.82%) Mainframe
8 4 (3.05%) Algorithms
8 4 (3.05%) Data Structures
9 3 (2.29%) Blog
10 2 (1.53%) Driving Licence
10 2 (1.53%) iSeries
10 2 (1.53%) Management Information System
10 2 (1.53%) PropTech
Operating Systems
1 45 (34.35%) Windows
2 23 (17.56%) Linux
3 22 (16.79%) Windows Server
4 5 (3.82%) Red Hat Enterprise Linux
5 4 (3.05%) Android
5 4 (3.05%) Apple iOS
5 4 (3.05%) CentOS
6 2 (1.53%) Unix
7 1 (0.76%) Windows 10
Processes & Methodologies
1 57 (43.51%) Mentoring
2 50 (38.17%) Coaching
3 41 (31.30%) Infrastructure Engineering
4 39 (29.77%) DevOps
5 28 (21.37%) Migration
5 28 (21.37%) Presales
6 26 (19.85%) Infrastructure as Code
7 25 (19.08%) Service Management
8 24 (18.32%) Agile
9 23 (17.56%) Cybersecurity
10 22 (16.79%) Operational Stability
11 21 (16.03%) Roadmaps
12 19 (14.50%) ITIL
13 18 (13.74%) Time Management
14 17 (12.98%) Platform Engineering
14 17 (12.98%) Problem-Solving
15 16 (12.21%) Identity Management
16 15 (11.45%) CRM
16 15 (11.45%) Software Licensing
17 14 (10.69%) CI/CD
Programming Languages
1 26 (19.85%) PowerShell
2 24 (18.32%) Python
3 11 (8.40%) SQL
4 9 (6.87%) Bash
5 6 (4.58%) Perl
6 5 (3.82%) Go
6 5 (3.82%) Shell Script
7 4 (3.05%) Java
8 3 (2.29%) JavaScript
9 2 (1.53%) C#
10 1 (0.76%) Kusto Query Language
Qualifications
1 15 (11.45%) Degree
2 10 (7.63%) Security Cleared
3 8 (6.11%) AWS Certification
4 7 (5.34%) Cisco Certification
5 6 (4.58%) Microsoft Certification
6 5 (3.82%) Computer Science Degree
7 4 (3.05%) CCIE
7 4 (3.05%) DV Cleared
7 4 (3.05%) JNCIE
8 3 (2.29%) Azure Certification
8 3 (2.29%) CCNA
8 3 (2.29%) CCNP
9 1 (0.76%) ITIL Certification
9 1 (0.76%) Master's Degree
9 1 (0.76%) SC Cleared
9 1 (0.76%) VMware Certified Professional (VCP)
Quality Assurance & Compliance
1 7 (5.34%) PCI DSS
2 5 (3.82%) ISO/IEC 27001
3 3 (2.29%) SOC 2
4 1 (0.76%) ISO/IEC 27002 (supersedes ISO/IEC 17799)
4 1 (0.76%) NIST
4 1 (0.76%) SLA
System Software
1 38 (29.01%) Active Directory
2 20 (15.27%) VMware Infrastructure
3 10 (7.63%) VMware ESXi
4 8 (6.11%) Docker
5 2 (1.53%) Virtual Desktop
5 2 (1.53%) Virtual Machines
6 1 (0.76%) Hyper-V
6 1 (0.76%) vCloud
6 1 (0.76%) Virtual Servers
6 1 (0.76%) vSphere
Systems Management
1 37 (28.24%) Ansible
2 21 (16.03%) Terraform
3 20 (15.27%) Single Sign-On
4 10 (7.63%) Failover Clustering
5 7 (5.34%) CA Single Sign-On
6 5 (3.82%) Microsoft Intune
7 4 (3.05%) Active Directory Federation Services
8 3 (2.29%) Kubernetes
8 3 (2.29%) NetIQ Identity Manager
8 3 (2.29%) Puppet
9 2 (1.53%) Grafana
9 2 (1.53%) Nagios
9 2 (1.53%) Prometheus
9 2 (1.53%) Rundeck
10 1 (0.76%) Host Intrusion Detection System
10 1 (0.76%) Netcool
10 1 (0.76%) Progress Chef
10 1 (0.76%) Salt
10 1 (0.76%) ZABBIX
Vendors
1 39 (29.77%) Microsoft
2 23 (17.56%) Dell
3 22 (16.79%) VMware
4 16 (12.21%) NetApp
5 15 (11.45%) Adobe
5 15 (11.45%) Apple
5 15 (11.45%) ServiceNow
6 13 (9.92%) Google
7 11 (8.40%) CyberArk
8 7 (5.34%) CA
8 7 (5.34%) Cisco
9 5 (3.82%) Teradata
9 5 (3.82%) Virgin Media
10 4 (3.05%) Red Hat
11 3 (2.29%) CheckPoint
11 3 (2.29%) ForgeRock
11 3 (2.29%) NetIQ
11 3 (2.29%) Oracle
12 2 (1.53%) Databricks
12 2 (1.53%) PagerDuty