Dell Jobs with Hybrid/Remote/WFH Options

Dell
UK > Work from Home

The table below provides summary statistics for permanent remote or hybrid work requiring knowledge or experience of Dell products and/or services. It includes a benchmarking guide to the annual salaries offered in vacancies that cited Dell over the 6 months leading up to 13 May 2025, comparing them to the same period in the previous two years.

The figures below represent the IT labour market in general and are not representative of salaries within Dell, Inc.

6 months to
13 May 2025
Same period 2024 Same period 2023
Rank 381 348 480
Rank change year-on-year -33 +132 +59
Permanent jobs citing Dell 82 252 188
As % of all permanent jobs with a WFH option 0.46% 0.75% 0.45%
As % of the Vendors category 1.00% 1.80% 1.12%
Number of salaries quoted 62 137 124
10th Percentile £24,000 £27,500 £31,250
25th Percentile £36,250 £36,250 £37,656
Median annual salary (50th Percentile) £50,000 £42,500 £50,000
Median % change year-on-year +17.65% -15.00% -4.76%
75th Percentile £55,000 £53,750 £60,000
90th Percentile £63,750 £70,000 £71,750
UK median annual salary £42,500 £40,000 £45,000
% change year-on-year +6.25% -11.11% -5.68%

All Vendors
Work from Home

Dell falls under the Vendor Products and Services category. For comparison with the information above, the following table provides summary statistics for all permanent job vacancies with a remote or hybrid options requiring knowledge or experience of all vendor products and services.

Permanent vacancies with a requirement for knowledge or experience of vendor products and services 8,176 13,963 16,772
As % of all permanent jobs with a WFH option 45.42% 41.31% 40.54%
Number of salaries quoted 4,545 9,946 11,164
10th Percentile £25,087 £31,500 £32,749
25th Percentile £36,250 £41,250 £43,500
Median annual salary (50th Percentile) £55,000 £55,000 £59,000
Median % change year-on-year - -6.78% +2.61%
75th Percentile £71,250 £71,250 £77,500
90th Percentile £92,500 £87,500 £92,500
UK median annual salary £55,000 £50,000 £57,500
% change year-on-year +10.00% -13.04% +4.55%

Dell
Trend for Jobs with a WFH Option

Job vacancies with remote working options citing Dell as a proportion of all IT jobs advertised.
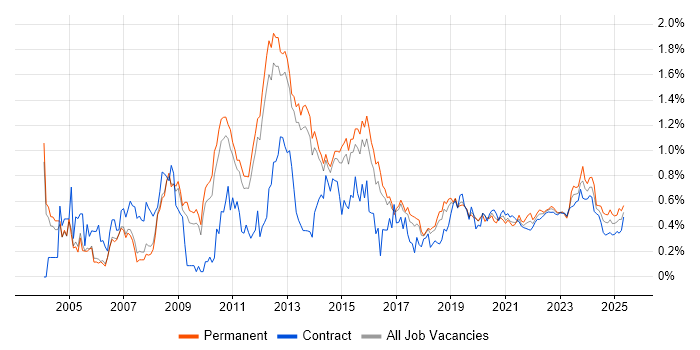
Dell trend for jobs with Hybrid/Remote/WFH options

Dell
Salary Trend for Jobs with a WFH Option

3-month moving average salary quoted in job vacancies with remote working options citing Dell.

Dell salary trend for jobs with a WFH option

Dell
Salary Histogram for Jobs with a WFH Option

Salary distribution for jobs with remote working options citing Dell over the 6 months to 13 May 2025.

Dell salary histogram for jobs with a WFH option

Dell
Co-occurring Skills and Capabilities with WFH Options by Category

The follow tables expand on the table above by listing co-occurrences grouped by category. The same employment type, locality and period is covered with up to 20 co-occurrences shown in each of the following categories:

Application Platforms
1 12 (14.63%) Microsoft Exchange
2 8 (9.76%) SharePoint
3 6 (7.32%) IIS
4 1 (1.22%) Apache Spark
Applications
1 2 (2.44%) Microsoft Office
Business Applications
1 11 (13.41%) JDE OneWorld
1 11 (13.41%) NetSuite
2 5 (6.10%) SAP HR
3 4 (4.88%) SAP HCM
4 2 (2.44%) Carpe Diem
Cloud Services
1 21 (25.61%) Boomi
2 11 (13.41%) Azure
3 10 (12.20%) AWS
3 10 (12.20%) Microsoft 365
4 5 (6.10%) SuccessFactors
5 3 (3.66%) Entra ID
6 1 (1.22%) GCP
6 1 (1.22%) iPaaS
6 1 (1.22%) OneDrive
6 1 (1.22%) PaaS
6 1 (1.22%) Power Platform
6 1 (1.22%) PowerApps
6 1 (1.22%) Rubrik
6 1 (1.22%) WhatsApp
Communications & Networking
1 16 (19.51%) Firewall
2 13 (15.85%) DNS
3 10 (12.20%) DHCP
4 8 (9.76%) SAN
5 7 (8.54%) Remote Desktop
6 6 (7.32%) WAN
7 5 (6.10%) TCP/IP
8 4 (4.88%) MPLS
9 3 (3.66%) VLAN
10 2 (2.44%) BGP
10 2 (2.44%) DWDM
10 2 (2.44%) Ethernet
10 2 (2.44%) GPON
10 2 (2.44%) OSPF
10 2 (2.44%) SD-WAN
10 2 (2.44%) WebEx
10 2 (2.44%) Wireless
11 1 (1.22%) Network Security
11 1 (1.22%) Unified Communications
11 1 (1.22%) Wi-Fi
Database & Business Intelligence
1 7 (8.54%) SQL Server
2 1 (1.22%) Amazon RDS
2 1 (1.22%) Apache Hive
2 1 (1.22%) Big Data
2 1 (1.22%) Data Lake
2 1 (1.22%) Data Warehouse
2 1 (1.22%) Hadoop
Development Applications
1 1 (1.22%) JIRA
General
1 33 (40.24%) Social Skills
2 27 (32.93%) Inclusion and Diversity
3 24 (29.27%) Marketing
4 14 (17.07%) Finance
5 5 (6.10%) Analytical Skills
5 5 (6.10%) Documentation Skills
6 4 (4.88%) Public Sector
7 3 (3.66%) Law
8 1 (1.22%) Retail
Job Titles
1 18 (21.95%) Sales Executive
2 16 (19.51%) Corporate Sales Executive
3 13 (15.85%) Senior
4 11 (13.41%) Developer
4 11 (13.41%) NetSuite Developer
5 10 (12.20%) Infrastructure Engineer
6 9 (10.98%) Consultant
7 8 (9.76%) 3rd Line Engineer
7 8 (9.76%) Analyst
8 6 (7.32%) 3rd Line Support
8 6 (7.32%) 3rd Line Support Engineer
8 6 (7.32%) Lead
8 6 (7.32%) Marketing Executive
8 6 (7.32%) Senior Marketing Executive
8 6 (7.32%) Support Engineer
8 6 (7.32%) Team Leader
9 5 (6.10%) SAP Consultant
9 5 (6.10%) Service Analyst
10 4 (4.88%) Managed Services Consultant
11 3 (3.66%) Senior Consultant
Libraries, Frameworks & Software Standards
1 12 (14.63%) JSON
1 12 (14.63%) REST
1 12 (14.63%) SOAP
1 12 (14.63%) Web Services
1 12 (14.63%) XML
2 11 (13.41%) CSS
2 11 (13.41%) CSS3
2 11 (13.41%) Hibernate
2 11 (13.41%) HTML
2 11 (13.41%) jQuery
3 4 (4.88%) Middleware
Miscellaneous
1 5 (6.10%) Onboarding
2 2 (2.44%) iPhone
2 2 (2.44%) Linux Command Line
3 1 (1.22%) Cyber Threat
3 1 (1.22%) Data Centre
3 1 (1.22%) Driving Licence
3 1 (1.22%) Management Information System
3 1 (1.22%) Replication
3 1 (1.22%) Team-Oriented Environment
Operating Systems
1 17 (20.73%) Windows
2 9 (10.98%) Windows Server
3 8 (9.76%) Linux
4 3 (3.66%) Android
5 2 (2.44%) Debian
5 2 (2.44%) SUSE
5 2 (2.44%) Ubuntu
6 1 (1.22%) Apple iOS
6 1 (1.22%) Red Hat Enterprise Linux
6 1 (1.22%) Unix
6 1 (1.22%) Windows 10
6 1 (1.22%) Windows Server 2016
Processes & Methodologies
1 25 (30.49%) Artificial Intelligence
2 22 (26.83%) IT Strategy
2 22 (26.83%) Technology Strategy
3 18 (21.95%) Email Marketing
4 16 (19.51%) Customer Experience
5 15 (18.29%) Customer Service
6 12 (14.63%) Data Management
7 11 (13.41%) CRM
7 11 (13.41%) ERP
7 11 (13.41%) Infrastructure Engineering
7 11 (13.41%) OO
7 11 (13.41%) OOP
7 11 (13.41%) Project Management
7 11 (13.41%) User Experience
7 11 (13.41%) UX Design
8 9 (10.98%) ITIL
8 9 (10.98%) Problem-Solving
9 6 (7.32%) B2B
9 6 (7.32%) B2B Marketing
9 6 (7.32%) Customer-Centricity
Programming Languages
1 14 (17.07%) SQL
2 12 (14.63%) JavaScript
3 3 (3.66%) PowerShell
4 2 (2.44%) Java
4 2 (2.44%) Python
5 1 (1.22%) Bash
Qualifications
1 10 (12.20%) Security Cleared
2 3 (3.66%) CCNA
2 3 (3.66%) Cisco Certification
2 3 (3.66%) Degree
2 3 (3.66%) Microsoft Certification
3 2 (2.44%) MCP
3 2 (2.44%) MCSA
4 1 (1.22%) AWS Certification
4 1 (1.22%) AWS Certified Cloud Practitioner
4 1 (1.22%) CCA
4 1 (1.22%) CCNP
4 1 (1.22%) CISM
4 1 (1.22%) CISSP
4 1 (1.22%) Citrix Certification
4 1 (1.22%) Computer Science Degree
4 1 (1.22%) DV Cleared
4 1 (1.22%) Master's Degree
4 1 (1.22%) MCSE
4 1 (1.22%) VMware Certified Professional (VCP)
Quality Assurance & Compliance
1 11 (13.41%) Accessibility
2 1 (1.22%) GDPR
2 1 (1.22%) Government Security Classifications
2 1 (1.22%) NIST
2 1 (1.22%) PCI DSS
2 1 (1.22%) QA
System Software
1 16 (19.51%) Active Directory
2 14 (17.07%) VMware Infrastructure
3 11 (13.41%) Hyper-V
4 9 (10.98%) vSphere
5 6 (7.32%) Terminal Services
6 5 (6.10%) VMware ESXi
7 3 (3.66%) Virtual Desktop
8 2 (2.44%) Firmware
8 2 (2.44%) Virtual Machines
8 2 (2.44%) VMware NSX
9 1 (1.22%) BitLocker
9 1 (1.22%) EMC RecoverPoint
9 1 (1.22%) XenApp
9 1 (1.22%) XenDesktop
Systems Management
1 4 (4.88%) vCenter Server
2 2 (2.44%) Avamar
2 2 (2.44%) Dell DRAC
2 2 (2.44%) Microsoft Intune
2 2 (2.44%) Single Sign-On
2 2 (2.44%) VxRail
3 1 (1.22%) Ansible
3 1 (1.22%) Backup Exec
3 1 (1.22%) EMC NetWorker
3 1 (1.22%) Failover Clustering
3 1 (1.22%) Progress Chef
3 1 (1.22%) Puppet
3 1 (1.22%) SCCM
3 1 (1.22%) Symantec Endpoint Protection
3 1 (1.22%) vRealize
3 1 (1.22%) WSUS
Vendors
1 46 (56.10%) Microsoft
2 40 (48.78%) Cisco
3 18 (21.95%) VMware
4 13 (15.85%) Salesforce
5 12 (14.63%) HP
5 12 (14.63%) NetApp
6 9 (10.98%) SAP
7 5 (6.10%) Fortinet
8 4 (4.88%) DocuSign
8 4 (4.88%) Veeam
9 3 (3.66%) Citrix
9 3 (3.66%) EMC
9 3 (3.66%) IBM
9 3 (3.66%) iManage
10 2 (2.44%) Aderant
10 2 (2.44%) BeyondTrust
10 2 (2.44%) Canon
11 1 (1.22%) CrowdStrike
11 1 (1.22%) N-able
11 1 (1.22%) Rapid7