Migration Jobs with Hybrid/Remote/WFH Options

Migration
UK > Work from Home

The table below provides summary statistics for permanent remote or hybrid work requiring Migration skills. It includes a benchmarking guide to the annual salaries offered in vacancies that cited Migration over the 6 months leading up to 24 March 2025, comparing them to the same period in the previous two years.

6 months to
24 Mar 2025
Same period 2024 Same period 2023
Rank 67 73 82
Rank change year-on-year +6 +9 +8
Permanent jobs citing Migration 653 1,346 1,859
As % of all permanent jobs with a WFH option 4.33% 4.19% 4.03%
As % of the Processes & Methodologies category 4.63% 4.54% 4.20%
Number of salaries quoted 465 906 1,461
10th Percentile £43,450 £38,125 £42,500
25th Percentile £56,250 £43,750 £53,750
Median annual salary (50th Percentile) £82,500 £57,500 £67,500
Median % change year-on-year +43.48% -14.81% +3.85%
75th Percentile £122,500 £75,000 £85,000
90th Percentile £152,500 £95,000 £97,500
UK median annual salary £70,000 £60,000 £67,500
% change year-on-year +16.67% -11.11% +3.85%

All Process and Methodology Skills
Work from Home

Migration falls under the Processes and Methodologies category. For comparison with the information above, the following table provides summary statistics for all permanent job vacancies with remote or hybrid options requiring process or methodology skills.

Permanent vacancies with a requirement for process or methodology skills 14,102 29,644 44,263
As % of all permanent jobs with a WFH option 93.51% 92.31% 96.02%
Number of salaries quoted 9,347 23,074 30,658
10th Percentile £32,389 £33,778 £37,500
25th Percentile £46,250 £42,500 £47,500
Median annual salary (50th Percentile) £60,000 £57,500 £62,500
Median % change year-on-year +4.35% -8.00% +4.17%
75th Percentile £80,000 £75,772 £82,500
90th Percentile £102,410 £95,000 £100,000
UK median annual salary £58,033 £55,000 £62,000
% change year-on-year +5.51% -11.29% +3.33%

Migration
Trend for Jobs with a WFH Option

Job vacancies with remote working options citing Migration as a proportion of all IT jobs advertised.
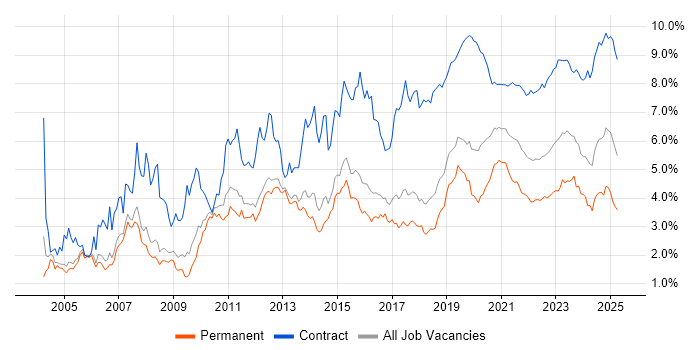
Migration trend for jobs with Hybrid/Remote/WFH options

Migration
Salary Trend for Jobs with a WFH Option

3-month moving average salary quoted in job vacancies with remote working options citing Migration.

Migration salary trend for jobs with a WFH option

Migration
Salary Histogram for Jobs with a WFH Option

Salary distribution for jobs with remote working options citing Migration over the 6 months to 24 March 2025.

Migration salary histogram for jobs with a WFH option

Migration
Co-occurring Skills and Capabilities with WFH Options by Category

The follow tables expand on the table above by listing co-occurrences grouped by category. The same employment type, locality and period is covered with up to 20 co-occurrences shown in each of the following categories:

Application Platforms
1 40 (6.13%) Apache
2 35 (5.36%) Apache Airflow
2 35 (5.36%) SharePoint
3 31 (4.75%) Microsoft Exchange
4 14 (2.14%) Apache Spark
5 7 (1.07%) Oracle SOA Suite
6 4 (0.61%) Confluence
7 3 (0.46%) CMS
7 3 (0.46%) OpenEdge
8 2 (0.31%) Oracle Workflow
8 2 (0.31%) Skype for Business
9 1 (0.15%) CICS
9 1 (0.15%) nginx
9 1 (0.15%) Umbraco
9 1 (0.15%) WordPress
Applications
1 19 (2.91%) Microsoft Excel
2 15 (2.30%) Microsoft Office
3 5 (0.77%) Microsoft Project
4 3 (0.46%) Microsoft PowerPoint
5 2 (0.31%) MS Visio
5 2 (0.31%) Oracle Smart View
5 2 (0.31%) Spreadsheet
Business Applications
1 44 (6.74%) NEC Housing
2 23 (3.52%) Dynamics CRM
3 20 (3.06%) SAP S/4HANA
4 13 (1.99%) NetSuite
5 9 (1.38%) Oracle EBS
5 9 (1.38%) Oracle ERP
6 7 (1.07%) Sage 200
6 7 (1.07%) Sage 50
7 4 (0.61%) Dynamics NAV
7 4 (0.61%) SAP MDG
8 2 (0.31%) Oracle BPM
8 2 (0.31%) Oracle Financials
8 2 (0.31%) Oracle General Ledger
8 2 (0.31%) Oracle Payables
8 2 (0.31%) PeopleSoft HCM
8 2 (0.31%) Raiser’s Edge
8 2 (0.31%) SAP CO
8 2 (0.31%) SAP FI
8 2 (0.31%) SAP FI/CO
8 2 (0.31%) SAP IBP
Cloud Services
1 202 (30.93%) Azure
2 138 (21.13%) AWS
3 75 (11.49%) GCP
4 72 (11.03%) Microsoft 365
5 53 (8.12%) Snowflake
6 50 (7.66%) Power Platform
7 43 (6.58%) SaaS
8 40 (6.13%) dbt
9 39 (5.97%) Amazon EC2
9 39 (5.97%) GitHub
10 37 (5.67%) Amazon EKS
11 36 (5.51%) Azure DevOps
12 35 (5.36%) Amazon ECS
13 34 (5.21%) Dagster
13 34 (5.21%) Dynamics 365
14 33 (5.05%) Entra ID
15 26 (3.98%) GitHub Actions
15 26 (3.98%) Serverless
16 17 (2.60%) OCI
16 17 (2.60%) PowerApps
Communications & Networking
1 26 (3.98%) Firewall
2 17 (2.60%) LAN
3 16 (2.45%) Wi-Fi
4 15 (2.30%) WAN
5 14 (2.14%) SD-WAN
6 12 (1.84%) DNS
7 11 (1.68%) VPN
8 6 (0.92%) VLAN
9 5 (0.77%) MPLS
9 5 (0.77%) Network Security
10 4 (0.61%) Cisco ASA
10 4 (0.61%) DHCP
10 4 (0.61%) HTTPS
10 4 (0.61%) Wireshark
11 3 (0.46%) Internet
12 2 (0.31%) Skype
12 2 (0.31%) TCP/IP
12 2 (0.31%) Wireless
13 1 (0.15%) SSL
13 1 (0.15%) Unified Communications
Database & Business Intelligence
1 165 (25.27%) Data Lake
2 60 (9.19%) SQL Server
3 51 (7.81%) Oracle Database
4 41 (6.28%) Power BI
5 35 (5.36%) Amazon Athena
6 34 (5.21%) Apache Arrow
6 34 (5.21%) Apache Iceberg
6 34 (5.21%) Apache Ignite
6 34 (5.21%) Dremio
7 32 (4.90%) Data Warehouse
8 26 (3.98%) Tableau
9 22 (3.37%) MySQL
10 21 (3.22%) Relational Database
11 20 (3.06%) NoSQL
12 19 (2.91%) PostgreSQL
13 17 (2.60%) Amazon Redshift
14 16 (2.45%) BigQuery
15 14 (2.14%) SQL Server Integration Services
16 13 (1.99%) Big Data
17 12 (1.84%) Amazon RDS
Development Applications
1 36 (5.51%) Git
2 22 (3.37%) Jenkins
2 22 (3.37%) JIRA
3 14 (2.14%) Gradle
4 11 (1.68%) SonarQube
5 6 (0.92%) Maven
5 6 (0.92%) Visual Studio
6 4 (0.61%) LSMW
6 4 (0.61%) WiX
7 3 (0.46%) AppScan
7 3 (0.46%) Atlassian Bamboo
8 2 (0.31%) Bugzilla
8 2 (0.31%) ERwin
8 2 (0.31%) GitLab
8 2 (0.31%) IBM UrbanCode
8 2 (0.31%) Subversion
8 2 (0.31%) Zephyr
9 1 (0.15%) gulp
9 1 (0.15%) xUnit.net
9 1 (0.15%) Yeoman
General
1 302 (46.25%) Finance
2 203 (31.09%) Social Skills
3 146 (22.36%) Front Office
4 69 (10.57%) Public Sector
5 61 (9.34%) Analytical Skills
6 57 (8.73%) Banking
7 55 (8.42%) Local Government
8 44 (6.74%) Police
9 37 (5.67%) Investment Banking
10 28 (4.29%) Inclusion and Diversity
11 25 (3.83%) Marketing
12 21 (3.22%) Legal
13 20 (3.06%) Games
14 17 (2.60%) Influencing Skills
14 17 (2.60%) Law
15 15 (2.30%) Presentation Skills
16 8 (1.23%) Retail
17 7 (1.07%) Manufacturing
17 7 (1.07%) Organisational Skills
18 5 (0.77%) Advertising
Job Titles
1 83 (12.71%) Lead
2 79 (12.10%) Consultant
3 77 (11.79%) Senior
4 64 (9.80%) Developer
5 62 (9.49%) Architect
6 52 (7.96%) Technical Consultant
7 49 (7.50%) Analyst
8 48 (7.35%) AWS Engineer
9 44 (6.74%) Implementation Consultant
9 44 (6.74%) Technical Implementation Consultant
10 41 (6.28%) Software Engineer
11 36 (5.51%) Data Governance Analyst
11 36 (5.51%) Data Governance Manager
11 36 (5.51%) Governance Manager
12 34 (5.21%) AWS Software Engineer
13 31 (4.75%) Programme Manager
14 30 (4.59%) Data Engineer
14 30 (4.59%) Head of Finance
15 26 (3.98%) Finance Manager
16 25 (3.83%) Project Manager
Libraries, Frameworks & Software Standards
1 44 (6.74%) PySpark
2 39 (5.97%) .NET
3 34 (5.21%) gRPC
3 34 (5.21%) NumPy
3 34 (5.21%) Pandas
3 34 (5.21%) Protocol Buffers
3 34 (5.21%) SciPy
4 29 (4.44%) HTML
5 24 (3.68%) CSS
6 23 (3.52%) XML
7 21 (3.22%) REST
8 19 (2.91%) Kafka
9 18 (2.76%) RESTful
10 17 (2.60%) SOAP
11 16 (2.45%) React
12 15 (2.30%) .NET Framework
13 14 (2.14%) Middleware
13 14 (2.14%) RabbitMQ
14 13 (1.99%) JSON
15 12 (1.84%) Web Services
Miscellaneous
1 147 (22.51%) Derivative
1 147 (22.51%) Foreign Exchange (FX)
2 146 (22.36%) Equities
2 146 (22.36%) Fixed Income
2 146 (22.36%) Hedge funds
3 57 (8.73%) Product Ownership
4 41 (6.28%) Legacy Systems
5 38 (5.82%) Cloud Native
6 22 (3.37%) Data Centre
7 20 (3.06%) Mobile Games
8 18 (2.76%) Public Cloud
9 16 (2.45%) Virtual Team
10 15 (2.30%) Enterprise Software
10 15 (2.30%) Mobile App
11 11 (1.68%) Greenfield Project
12 10 (1.53%) Management Information System
12 10 (1.53%) Onboarding
13 8 (1.23%) Hybrid Cloud
13 8 (1.23%) Replication
14 7 (1.07%) Algorithms
Operating Systems
1 59 (9.04%) Windows
2 38 (5.82%) Linux
3 29 (4.44%) Windows Server
4 12 (1.84%) Windows 10
5 10 (1.53%) Android
6 8 (1.23%) Apple iOS
7 6 (0.92%) Windows Server 2019
8 5 (0.77%) Mac OS
8 5 (0.77%) Windows Server 2012
8 5 (0.77%) Windows Server 2016
9 3 (0.46%) CentOS
9 3 (0.46%) Data ONTAP
9 3 (0.46%) Ubuntu
9 3 (0.46%) Windows Server 2008
10 1 (0.15%) Debian
Processes & Methodologies
1 256 (39.20%) Agile
2 207 (31.70%) Data Migration
3 153 (23.43%) Data Governance
4 142 (21.75%) Roadmaps
5 131 (20.06%) Data Management
6 114 (17.46%) Problem-Solving
6 114 (17.46%) Regulatory Compliance
7 112 (17.15%) Investment Management
8 97 (14.85%) DevOps
9 78 (11.94%) CI/CD
9 78 (11.94%) Software Engineering
10 76 (11.64%) Mentoring
11 66 (10.11%) Data Cleansing
12 61 (9.34%) CRM
13 57 (8.73%) Business Intelligence
14 56 (8.58%) Project Management
15 55 (8.42%) Data Modelling
15 55 (8.42%) ERP
16 53 (8.12%) Analytics
17 48 (7.35%) Coaching
Programming Languages
1 179 (27.41%) SQL
2 110 (16.85%) Python
3 72 (11.03%) JavaScript
4 70 (10.72%) Java
5 52 (7.96%) PL/SQL
6 49 (7.50%) TypeScript
7 43 (6.58%) PowerShell
8 40 (6.13%) C#
9 14 (2.14%) Bash
10 8 (1.23%) Bicep
10 8 (1.23%) Kotlin
10 8 (1.23%) Objective-C
10 8 (1.23%) Swift
11 5 (0.77%) PHP
12 4 (0.61%) C++
12 4 (0.61%) Go
12 4 (0.61%) T-SQL
13 3 (0.46%) Progress 4GL
13 3 (0.46%) VBA
14 2 (0.31%) VB
Qualifications
1 75 (11.49%) Degree
2 54 (8.27%) DBS Check
3 46 (7.04%) Security Cleared
4 41 (6.28%) SC Cleared
5 35 (5.36%) Computer Science Degree
6 27 (4.13%) Azure Certification
7 19 (2.91%) AWS Certification
8 13 (1.99%) PMI Certification
8 13 (1.99%) PMP
9 8 (1.23%) AWS Certified Solutions Architect
9 8 (1.23%) Cisco Certification
10 7 (1.07%) CCNA
10 7 (1.07%) DV Cleared
10 7 (1.07%) Microsoft Certification
11 6 (0.92%) Master's Degree
12 4 (0.61%) CCNP
13 3 (0.46%) ACCA
13 3 (0.46%) Linux+ Certification
13 3 (0.46%) RHCE
13 3 (0.46%) TOGAF Certification
Quality Assurance & Compliance
1 55 (8.42%) MiFID
2 54 (8.27%) Accessibility
3 44 (6.74%) Data Quality
4 33 (5.05%) QA
5 13 (1.99%) GDPR
6 9 (1.38%) ISO/IEC 27001
7 7 (1.07%) ISO 9001
8 6 (0.92%) SLA
9 4 (0.61%) Cyber Essentials
9 4 (0.61%) PCI DSS
10 3 (0.46%) HIPAA
10 3 (0.46%) NIST
10 3 (0.46%) PMO
11 1 (0.15%) 21 CFR Part 11
11 1 (0.15%) Actionable Recommendations
11 1 (0.15%) Cyber Essentials PLUS
11 1 (0.15%) Dublin Core
11 1 (0.15%) GMP
11 1 (0.15%) GxP
System Software
1 48 (7.35%) Active Directory
2 39 (5.97%) Docker
3 19 (2.91%) VMware Infrastructure
4 11 (1.68%) Hyper-V
4 11 (1.68%) Virtual Desktop
5 6 (0.92%) Virtual Machines
6 4 (0.61%) HDFS
7 3 (0.46%) Dovecot
7 3 (0.46%) Postfix
7 3 (0.46%) VMware ESXi
8 2 (0.31%) Firmware
8 2 (0.31%) vSphere
9 1 (0.15%) XenApp
Systems Management
1 41 (6.28%) Kubernetes
2 26 (3.98%) Microsoft Intune
3 25 (3.83%) Terraform
4 13 (1.99%) Prometheus
4 13 (1.99%) Single Sign-On
5 8 (1.23%) Ansible
6 6 (0.92%) Argo
7 4 (0.61%) Active Directory Federation Services
7 4 (0.61%) FortiGate
7 4 (0.61%) Progress Chef
7 4 (0.61%) Puppet
8 3 (0.46%) SCCM
9 2 (0.31%) Forefront Identity Manager
9 2 (0.31%) Rundeck
9 2 (0.31%) vCenter Server
10 1 (0.15%) Grafana
10 1 (0.15%) Istio
10 1 (0.15%) Kibana
10 1 (0.15%) logstash
10 1 (0.15%) Tivoli Storage Manager
Vendors
1 146 (22.36%) Microsoft
2 84 (12.86%) Oracle
3 44 (6.74%) NEC
4 35 (5.36%) SAP
5 34 (5.21%) Google
6 27 (4.13%) Databricks
7 26 (3.98%) VMware
8 16 (2.45%) Cisco
9 15 (2.30%) Salesforce
10 14 (2.14%) New Relic
11 12 (1.84%) Citrix
12 8 (1.23%) MuleSoft
13 7 (1.07%) IBM
13 7 (1.07%) PeopleSoft
13 7 (1.07%) Sage
14 6 (0.92%) Aruba
14 6 (0.92%) Foundry
14 6 (0.92%) iManage
14 6 (0.92%) Palantir
14 6 (0.92%) Teradata