zOS Jobs with Work from Home Options

IBM z/OS
UK > Work from Home

The table below provides summary statistics for permanent job vacancies with an option to work from home (WFH) and a requirement for zOS skills. Included is a benchmarking guide to the salaries offered in vacancies that have cited zOS over the 6 months to 1 May 2024 with a comparison to the same period in the previous 2 years.

6 months to
1 May 2024
Same period 2023 Same period 2022
Rank 547 652 772
Rank change year-on-year +105 +120 -224
Permanent jobs citing zOS 42 19 69
As % of all permanent jobs with a WFH option 0.12% 0.044% 0.10%
As % of the Operating Systems category 0.89% 0.29% 0.58%
Number of salaries quoted 38 14 24
10th Percentile - £51,250 £39,000
25th Percentile £42,139 £51,833 £42,500
Median annual salary (50th Percentile) £87,610 £54,882 £60,000
Median % change year-on-year +59.63% -8.53% +20.00%
75th Percentile £92,000 £71,652 £65,313
90th Percentile £122,608 - £71,250
UK median annual salary £87,610 £62,500 £60,000
% change year-on-year +40.18% +4.17% -4.00%

All Operating Systems
Work from Home

zOS is in the Operating Systems category. The following table is for comparison with the above and provides summary statistics for all permanent job vacancies with a WFH option and a requirement for operating system skills.

Permanent vacancies with a requirement for operating system skills 4,725 6,609 11,960
As % of all permanent jobs with a WFH option 13.96% 15.48% 17.68%
Number of salaries quoted 3,678 4,843 7,454
10th Percentile £30,000 £30,500 £30,500
25th Percentile £38,750 £41,250 £40,776
Median annual salary (50th Percentile) £52,500 £55,000 £55,000
Median % change year-on-year -4.55% - +4.76%
75th Percentile £66,813 £75,000 £73,250
90th Percentile £82,500 £92,500 £87,500
UK median annual salary £45,000 £52,500 £52,500
% change year-on-year -14.29% - +5.00%

zOS
Trend for Jobs with a WFH Option

Job vacancies with a work from home option citing zOS as a proportion of all IT jobs advertised.
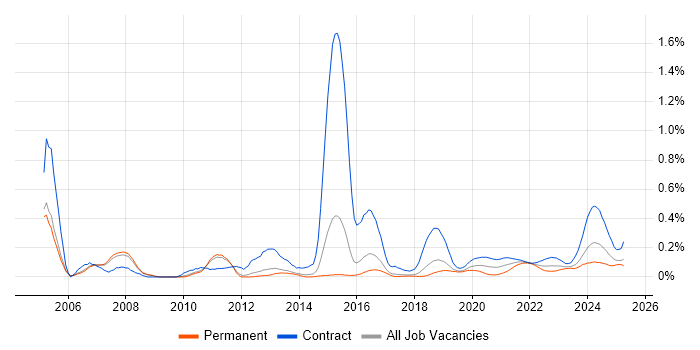
zOS trend for jobs with a WFH option

zOS
Salary Trend for Jobs with a WFH Option

3-month moving average salary quoted in job vacancies with a work from home option citing zOS.

zOS salary trend for jobs with a WFH option

zOS
Salary Histogram for Jobs with a WFH Option

Salary distribution for jobs with a work from home option citing zOS over the 6 months to 1 May 2024.

zOS salary histogram for jobs with a WFH option

zOS
Co-occurring Skills and Capabilities with WFH Options by Category

The follow tables expand on the table above by listing co-occurrences grouped by category. The same employment type, locality and period is covered with up to 20 co-occurrences shown in each of the following categories:

Application Platforms
1 3 (7.14%) CICS
2 2 (4.76%) SAS
Cloud Services
1 16 (38.10%) GCP
2 4 (9.52%) Amazon S3
2 4 (9.52%) AWS
2 4 (9.52%) Azure
2 4 (9.52%) Azure Sentinel
Communications & Networking
1 1 (2.38%) DWDM
Database & Business Intelligence
1 24 (57.14%) SQL Server
2 16 (38.10%) DB2
3 12 (28.57%) BigQuery
3 12 (28.57%) Data Hub
3 12 (28.57%) Enterprise Data Warehouse
3 12 (28.57%) MongoDB
4 3 (7.14%) Easytrieve
5 1 (2.38%) Relational Database
General
1 27 (64.29%) Social Skills
2 24 (57.14%) Banking
2 24 (57.14%) Finance
3 20 (47.62%) Financial Institution
Job Titles
1 12 (28.57%) Lead
1 12 (28.57%) Technical Leader
2 10 (23.81%) Infrastructure Engineer
3 8 (19.05%) Database Engineer
4 4 (9.52%) Data Engineer
4 4 (9.52%) DB2 DBA
4 4 (9.52%) DBA
4 4 (9.52%) Security Engineer
5 2 (4.76%) Programmer
5 2 (4.76%) Systems Programmer
5 2 (4.76%) z/OS Systems Programmer
6 1 (2.38%) Administrator
6 1 (2.38%) DB2 Administrator
6 1 (2.38%) IBM Storage Engineer
6 1 (2.38%) Mainframe Support
6 1 (2.38%) Remote Support Engineer
6 1 (2.38%) Storage Engineer
6 1 (2.38%) Support Engineer
Libraries, Frameworks & Software Standards
1 12 (28.57%) Kafka
2 8 (19.05%) Middleware
3 3 (7.14%) ISPF
3 3 (7.14%) XML
Miscellaneous
1 20 (47.62%) Cyberattack
1 20 (47.62%) Data Fabric
2 16 (38.10%) Public Cloud
3 13 (30.95%) Mainframe
4 11 (26.19%) Data Centre
5 10 (23.81%) IBM Mainframe
6 8 (19.05%) Cyber Threat
6 8 (19.05%) Replication
7 4 (9.52%) Cyber Kill Chain
8 3 (7.14%) Distributed Computing
8 3 (7.14%) VSAM
9 1 (2.38%) LPAR
Operating Systems
1 25 (59.52%) Linux
2 24 (57.14%) Windows
3 12 (28.57%) CentOS
3 12 (28.57%) Solaris
3 12 (28.57%) Ubuntu
3 12 (28.57%) Unix
Processes & Methodologies
1 24 (57.14%) Disaster Recovery
1 24 (57.14%) ETL
2 16 (38.10%) Incident Response
3 13 (30.95%) Performance Monitoring
4 12 (28.57%) Analytics
4 12 (28.57%) Data Management
4 12 (28.57%) Database Optimisation
4 12 (28.57%) Key Management
5 11 (26.19%) Infrastructure Engineering
6 10 (23.81%) Information Security
7 9 (21.43%) Agile
8 8 (19.05%) Batch Processing
8 8 (19.05%) Data Encryption
8 8 (19.05%) Problem-Solving
9 4 (9.52%) Dynamic Application Security Testing
9 4 (9.52%) Identity Access Management
9 4 (9.52%) MITRE ATT&CK
9 4 (9.52%) SIEM
9 4 (9.52%) Static Application Security Testing
9 4 (9.52%) Zero Trust
Programming Languages
1 15 (35.71%) SQL
2 7 (16.67%) JCL
3 6 (14.29%) REXX
4 3 (7.14%) COBOL
5 2 (4.76%) Assembly Language
6 1 (2.38%) CLIST
Qualifications
1 10 (23.81%) SC Cleared
1 10 (23.81%) Security Cleared
2 4 (9.52%) CISM
2 4 (9.52%) CISSP
3 1 (2.38%) Degree
Quality Assurance & Compliance
1 4 (9.52%) ISO/IEC 27001
1 4 (9.52%) ISO/IEC 27002 (supersedes ISO/IEC 17799)
1 4 (9.52%) NIST
System Software
1 7 (16.67%) Time Sharing Option
2 5 (11.90%) RACF
3 2 (4.76%) ACF2
4 1 (2.38%) Job Entry Subsystem
4 1 (2.38%) Microcode
4 1 (2.38%) NFS
Systems Management
1 3 (7.14%) MAINVIEW
2 2 (4.76%) OMEGAMON
Vendors
1 25 (59.52%) IBM
2 12 (28.57%) Databricks
2 12 (28.57%) F5
2 12 (28.57%) Oracle
3 6 (14.29%) Splunk
4 4 (9.52%) Qualys
5 3 (7.14%) BMC
5 3 (7.14%) Broadcom
6 1 (2.38%) Brocade
6 1 (2.38%) CA
6 1 (2.38%) Dell
6 1 (2.38%) Microsoft