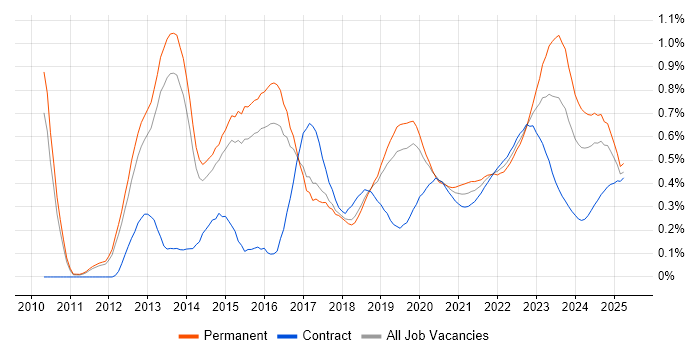
Private Cloud Jobs with Work from Home Options

Private Cloud
UK > Work from Home

The table below looks at the prevalence of the term Private Cloud in remote or hybrid work. Included is a benchmarking guide to the salaries offered in vacancies that cited Private Cloud over the 6 months leading up to 26 July 2024, comparing them to the same period in the previous two years.

6 months to
26 Jul 2024
Same period 2023 Same period 2022
Rank 396 325 565
Rank change year-on-year -71 +240 -84
Permanent jobs citing Private Cloud 140 288 377
As % of all permanent jobs with a WFH option 0.50% 0.88% 0.48%
As % of the Miscellaneous category 1.46% 2.26% 1.03%
Number of salaries quoted 114 212 236
10th Percentile £38,000 £39,294 £41,875
25th Percentile £43,152 £56,219 £50,000
Median annual salary (50th Percentile) £61,250 £65,351 £70,000
Median % change year-on-year -6.27% -6.64% +7.69%
75th Percentile £82,500 £79,750 £87,500
90th Percentile £90,000 £87,419 £96,250
UK median annual salary £62,500 £65,351 £68,823
% change year-on-year -4.36% -5.05% +5.88%

All Generic Skills
Work from Home

Private Cloud falls under the General and Transferable Skills category. For comparison with the information above, the following table provides summary statistics for all permanent job vacancies with remote or hybrid options requiring generic IT skills.

Permanent vacancies with a requirement for generic IT skills 9,605 12,729 36,632
As % of all permanent jobs with a WFH option 34.38% 38.79% 46.65%
Number of salaries quoted 6,855 9,924 18,426
10th Percentile £33,500 £40,000 £37,500
25th Percentile £45,000 £50,000 £47,500
Median annual salary (50th Percentile) £60,000 £65,000 £65,000
Median % change year-on-year -7.69% - +8.33%
75th Percentile £83,750 £85,000 £85,000
90th Percentile £117,500 £107,500 £100,000
UK median annual salary £55,000 £64,000 £62,500
% change year-on-year -14.06% +2.40% +4.17%

Private Cloud
Trend for Jobs with a WFH Option

Job vacancies with a work from home option citing Private Cloud as a proportion of all IT jobs advertised.

Private Cloud trend for jobs with a WFH option

Private Cloud
Salary Trend for Jobs with a WFH Option

3-month moving average salary quoted in job vacancies with a work from home option citing Private Cloud.

Private Cloud salary trend for jobs with a WFH option

Private Cloud
Salary Histogram for Jobs with a WFH Option

Salary distribution for jobs with a work from home option citing Private Cloud over the 6 months to 26 July 2024.

Private Cloud salary histogram for jobs with a WFH option

Private Cloud
Co-occurring Skills and Capabilities with WFH Options by Category

The follow tables expand on the table above by listing co-occurrences grouped by category. The same employment type, locality and period is covered with up to 20 co-occurrences shown in each of the following categories:

Application Platforms
1 4 (2.86%) WebSphere
2 3 (2.14%) Microsoft Exchange
3 2 (1.43%) SharePoint
Business Applications
1 2 (1.43%) SAP S/4HANA
Cloud Services
1 94 (67.14%) Azure
2 79 (56.43%) AWS
3 35 (25.00%) Microsoft 365
4 13 (9.29%) GitHub
5 9 (6.43%) Entra ID
6 5 (3.57%) Cloud Computing
6 5 (3.57%) IaaS
7 4 (2.86%) PaaS
8 3 (2.14%) Azure AKS
8 3 (2.14%) Azure Cosmos DB
8 3 (2.14%) Datadog
8 3 (2.14%) GitHub Actions
9 2 (1.43%) Azure DevOps
9 2 (1.43%) GCP
9 2 (1.43%) SaaS
Communications & Networking
1 11 (7.86%) Firewall
2 10 (7.14%) WAN
3 9 (6.43%) LAN
4 5 (3.57%) SD-WAN
4 5 (3.57%) VPN
5 4 (2.86%) Wi-Fi
5 4 (2.86%) Wireless
6 3 (2.14%) DHCP
6 3 (2.14%) DNS
6 3 (2.14%) NGFW
6 3 (2.14%) SAN
7 2 (1.43%) 5G
7 2 (1.43%) Broadband
7 2 (1.43%) iSCSI
7 2 (1.43%) Skype
7 2 (1.43%) VoIP
8 1 (0.71%) MPLS
8 1 (0.71%) Remote Desktop
8 1 (0.71%) WLAN
Database & Business Intelligence
1 5 (3.57%) DTS
2 4 (2.86%) DB2
3 3 (2.14%) Azure SQL Database
3 3 (2.14%) MariaDB
3 3 (2.14%) MongoDB
3 3 (2.14%) MySQL
3 3 (2.14%) PostgreSQL
3 3 (2.14%) Redis
4 2 (1.43%) Amazon RDS
4 2 (1.43%) Relational Database
5 1 (0.71%) SQL Server
Development Applications
1 57 (40.71%) GitLab
2 2 (1.43%) Octopus Deploy
2 2 (1.43%) Selenium
General
1 21 (15.00%) Finance
2 12 (8.57%) Social Skills
3 8 (5.71%) Marketing
4 5 (3.57%) Publishing
4 5 (3.57%) Social Science
5 3 (2.14%) Analytical Skills
5 3 (2.14%) Inclusion and Diversity
6 2 (1.43%) Law
6 2 (1.43%) Legal
7 1 (0.71%) Banking
7 1 (0.71%) Public Sector
Job Titles
1 34 (24.29%) Lead
2 30 (21.43%) Developer
3 25 (17.86%) Technical Leader
4 23 (16.43%) Full Stack Developer
5 17 (12.14%) Architect
5 17 (12.14%) Senior
6 14 (10.00%) Cloud Engineer
7 13 (9.29%) Azure Engineer
8 11 (7.86%) Software Architect
9 8 (5.71%) Kubernetes Engineer
9 8 (5.71%) Lead Developer
9 8 (5.71%) Lead Full Stack Developer
10 7 (5.00%) Java Developer
11 6 (4.29%) Senior Software Engineer
11 6 (4.29%) Software Engineer
12 5 (3.57%) Senior Developer
12 5 (3.57%) Senior Java Developer
12 5 (3.57%) Support Officer
13 4 (2.86%) Infrastructure Architect
13 4 (2.86%) Integration Architect
Libraries, Frameworks & Software Standards
1 31 (22.14%) React
2 4 (2.86%) WebSphere MQ
3 3 (2.14%) REST
3 3 (2.14%) SAML
4 2 (1.43%) .NET
4 2 (1.43%) Elastic Stack
4 2 (1.43%) GraphQL
4 2 (1.43%) gRPC
4 2 (1.43%) OpenFin
4 2 (1.43%) Playwright
4 2 (1.43%) Reactive Extensions
4 2 (1.43%) RxJS
5 1 (0.71%) ARM Templates
5 1 (0.71%) JSON
5 1 (0.71%) Middleware
5 1 (0.71%) YAML
Miscellaneous
1 31 (22.14%) Data Centre
2 11 (7.86%) Cloud Native
3 7 (5.00%) Management Information System
4 3 (2.14%) Tandem
5 2 (1.43%) Replication
6 1 (0.71%) Public Cloud
Operating Systems
1 36 (25.71%) Windows
2 26 (18.57%) Windows 10
3 8 (5.71%) Linux
3 8 (5.71%) Windows Server
4 4 (2.86%) Red Hat Enterprise Linux
5 1 (0.71%) CentOS
Processes & Methodologies
1 68 (48.57%) Open Source
2 67 (47.86%) Agile
3 61 (43.57%) Continuous Integration
4 59 (42.14%) Full Stack Development
5 46 (32.86%) Software Engineering
6 42 (30.00%) Code Quality
7 37 (26.43%) Requirements Analysis
8 33 (23.57%) DevOps
9 28 (20.00%) Cybersecurity
9 28 (20.00%) Scrum
10 26 (18.57%) Kanban
10 26 (18.57%) Presales
10 26 (18.57%) Software Licensing
11 23 (16.43%) Infrastructure as Code
12 19 (13.57%) CI/CD
13 17 (12.14%) Containerisation
14 15 (10.71%) Continuous Deployment
14 15 (10.71%) Progressive Web App
15 8 (5.71%) Fintech
16 6 (4.29%) Technology Strategy
Programming Languages
1 59 (42.14%) Java
2 57 (40.71%) TypeScript
3 41 (29.29%) JavaScript
4 13 (9.29%) PowerShell
5 11 (7.86%) Python
6 5 (3.57%) SQL
7 2 (1.43%) Bash
7 2 (1.43%) C#
Qualifications
1 70 (50.00%) Security Cleared
2 38 (27.14%) SC Cleared
3 28 (20.00%) Degree
3 28 (20.00%) Microsoft Certification
4 26 (18.57%) MCP
5 4 (2.86%) RHCA
5 4 (2.86%) TOGAF Certification
6 3 (2.14%) DV Cleared
7 2 (1.43%) AWS Certification
7 2 (1.43%) CCNA
7 2 (1.43%) Cisco Certification
7 2 (1.43%) MCSA
7 2 (1.43%) PMI Certification
7 2 (1.43%) PMP
7 2 (1.43%) SAP Certification
7 2 (1.43%) VMware Certified Professional (VCP)
8 1 (0.71%) ITIL Certification
Quality Assurance & Compliance
1 4 (2.86%) QA
2 2 (1.43%) PMO
3 1 (0.71%) ISO/IEC 27001
3 1 (0.71%) SLA
System Software
1 35 (25.00%) Active Directory
2 12 (8.57%) VMware Infrastructure
3 7 (5.00%) vSphere
4 5 (3.57%) VMware ESXi
5 4 (2.86%) Docker
6 3 (2.14%) Hyper-V
7 2 (1.43%) Virtual Desktop
Systems Management
1 14 (10.00%) Kubernetes
1 14 (10.00%) Terraform
2 3 (2.14%) Active Directory Federation Services
2 3 (2.14%) Ansible
2 3 (2.14%) Microsoft Intune
3 2 (1.43%) ZABBIX
4 1 (0.71%) FortiGate
4 1 (0.71%) Grafana
4 1 (0.71%) Nagios
4 1 (0.71%) Prometheus
4 1 (0.71%) Rancher
4 1 (0.71%) vCenter Server
Vendors
1 38 (27.14%) Microsoft
2 26 (18.57%) Adobe
2 26 (18.57%) Apple
3 14 (10.00%) VMware
4 8 (5.71%) Citrix
5 7 (5.00%) Cisco
6 6 (4.29%) Juniper
7 5 (3.57%) Red Hat
8 4 (2.86%) IBM
8 4 (2.86%) Oracle
9 3 (2.14%) Meraki
9 3 (2.14%) ServiceNow
10 2 (1.43%) Draytek
10 2 (1.43%) Finsemble
10 2 (1.43%) Fortinet
10 2 (1.43%) Mitel
10 2 (1.43%) Palo Alto
10 2 (1.43%) SAP
10 2 (1.43%) Sophos
11 1 (0.71%) Veeam