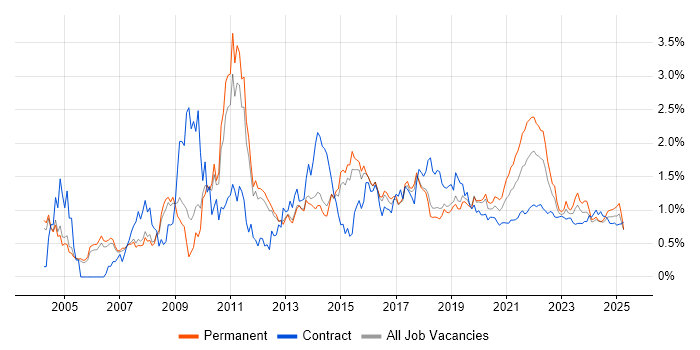
Hybrid/Remote Virtual Team Job Trends

Virtual Team (including Distributed Team, Remote Team, Dispersed Team)
UK > Work from Home

The table below looks at the prevalence of the term Virtual Team in remote or hybrid work. Included is a benchmarking guide to the salaries offered in vacancies that cited Virtual Team over the 6 months leading up to 18 September 2025, comparing them to the same period in the previous two years.

6 months to
18 Sep 2025
Same period 2024 Same period 2023
Rank 308 336 272
Rank change year-on-year +28 -64 -74
Permanent jobs citing Virtual Team 114 167 277
As % of all permanent jobs with a WFH option 0.70% 0.71% 1.13%
As % of the Miscellaneous category 1.66% 2.11% 2.70%
Number of salaries quoted 92 87 194
10th Percentile £25,000 £42,500 £46,267
25th Percentile £31,188 £46,250 £52,500
Median annual salary (50th Percentile) £53,750 £60,000 £72,500
Median % change year-on-year -10.42% -17.24% +3.57%
75th Percentile £72,875 £97,500 £96,539
90th Percentile £93,625 £115,000 £107,500
UK median annual salary £62,500 £65,000 £60,800
% change year-on-year -3.85% +6.91% -13.14%

All Generic Skills
Work from Home

Virtual Team falls under the General and Transferable Skills category. For comparison with the information above, the following table provides summary statistics for all permanent job vacancies with remote or hybrid options requiring generic IT skills.

Permanent vacancies with a requirement for generic IT skills 6,860 7,917 10,258
As % of all permanent jobs with a WFH option 42.09% 33.78% 41.77%
Number of salaries quoted 3,525 4,789 8,281
10th Percentile £30,500 £35,000 £39,294
25th Percentile £41,250 £46,250 £49,375
Median annual salary (50th Percentile) £60,000 £62,500 £65,000
Median % change year-on-year -4.00% -3.85% -
75th Percentile £85,000 £89,000 £85,000
90th Percentile £115,000 £122,500 £106,289
UK median annual salary £55,000 £60,000 £62,500
% change year-on-year -8.33% -4.00% -

Virtual Team
Trend for Jobs with a WFH Option

Job vacancies with remote working options citing Virtual Team as a proportion of all IT jobs advertised.

Virtual Team trend for jobs with Hybrid/Remote/WFH options

Virtual Team
Salary Trend for Jobs with Hybrid Work Options

Salary distribution trend for jobs with remote work options citing Virtual Team.

Salary distribution trend for jobs with remote work options citing Virtual Team

Virtual Team
Salary Histogram for Jobs with a WFH Option

Salary distribution for jobs with remote working options citing Virtual Team over the 6 months to 18 September 2025.

Virtual Team salary histogram for jobs with a WFH option

Virtual Team
Co-occurring Skills and Capabilities with WFH Options by Category

The follow tables expand on the table above by listing co-occurrences grouped by category. The same employment type, locality and period is covered with up to 20 co-occurrences shown in each of the following categories:

Application Platforms
1 3 (2.63%) SharePoint
2 2 (1.75%) WordPress
3 1 (0.88%) CMS
3 1 (0.88%) Headless CMS
Applications
1 3 (2.63%) Microsoft Excel
1 3 (2.63%) Microsoft Office
2 1 (0.88%) Adobe XD
2 1 (0.88%) Microsoft PowerPoint
2 1 (0.88%) Sketch
Business Applications
1 6 (5.26%) NetSuite
2 5 (4.39%) Magento
3 3 (2.63%) Dynamics CRM
3 3 (2.63%) SAP PP
3 3 (2.63%) SAP S/4HANA
3 3 (2.63%) SAP SCM
4 2 (1.75%) SAP APO
4 2 (1.75%) SAP EWM
5 1 (0.88%) SAP HCM
5 1 (0.88%) SAP IBP
5 1 (0.88%) SAP LE
5 1 (0.88%) SAP MM
5 1 (0.88%) SAP QM
5 1 (0.88%) SAP SD
5 1 (0.88%) SAP WM
5 1 (0.88%) Shopify
Cloud Services
1 27 (23.68%) Azure
2 8 (7.02%) AWS
3 6 (5.26%) SaaS
4 4 (3.51%) Cloud Computing
5 3 (2.63%) Amazon EC2
5 3 (2.63%) Amazon S3
5 3 (2.63%) AWS CloudFormation
5 3 (2.63%) AWS Lambda
5 3 (2.63%) Azure DevOps
5 3 (2.63%) Boomi
5 3 (2.63%) Serverless
5 3 (2.63%) Virtual Private Cloud
6 2 (1.75%) Amazon Ads
6 2 (1.75%) Copilot Studio
6 2 (1.75%) Entra ID
6 2 (1.75%) Facebook Ads
6 2 (1.75%) Google Ads
6 2 (1.75%) Microsoft Copilot
7 1 (0.88%) Dynamics 365
7 1 (0.88%) Google Drive
Communications & Networking
1 7 (6.14%) Firewall
2 4 (3.51%) VPN
3 3 (2.63%) DNS
3 3 (2.63%) Ethernet
3 3 (2.63%) Internet
3 3 (2.63%) Wi-Fi
3 3 (2.63%) Wireless
4 2 (1.75%) Intrusion Detection
4 2 (1.75%) MPLS
4 2 (1.75%) TCP/IP
5 1 (0.88%) BGP
5 1 (0.88%) Cisco IOS
5 1 (0.88%) IOS XR
5 1 (0.88%) Multicast
5 1 (0.88%) Network Security
5 1 (0.88%) OSPF
5 1 (0.88%) SD-WAN
5 1 (0.88%) WAN
Database & Business Intelligence
1 16 (14.04%) MySQL
2 15 (13.16%) SQL Server
3 4 (3.51%) Relational Database
4 3 (2.63%) Amazon RDS
5 1 (0.88%) Elasticsearch
5 1 (0.88%) NoSQL
5 1 (0.88%) PostgreSQL
5 1 (0.88%) RavenDB
Development Applications
1 12 (10.53%) Git
2 9 (7.89%) JIRA
3 4 (3.51%) Visual Studio
4 3 (2.63%) GDB
5 2 (1.75%) Jenkins
6 1 (0.88%) Artifactory
6 1 (0.88%) IntelliJ
6 1 (0.88%) PyCharm
6 1 (0.88%) Visual Studio Code
6 1 (0.88%) Vite
6 1 (0.88%) webpack
General
1 58 (50.88%) Social Skills
2 27 (23.68%) Finance
3 13 (11.40%) Analytical Skills
4 12 (10.53%) Advertising
5 10 (8.77%) Legal
5 10 (8.77%) Marketing
6 9 (7.89%) Games
7 6 (5.26%) Organisational Skills
7 6 (5.26%) Presentation Skills
7 6 (5.26%) Telecoms
8 5 (4.39%) Electronics
9 4 (3.51%) Inclusion and Diversity
9 4 (3.51%) Tech for Good
10 3 (2.63%) Documentation Skills
10 3 (2.63%) Manufacturing
10 3 (2.63%) Public Sector
11 2 (1.75%) Banking
11 2 (1.75%) General Ledger
11 2 (1.75%) Retail
11 2 (1.75%) Welsh Language
Job Titles
1 28 (24.56%) Senior
2 27 (23.68%) Developer
3 15 (13.16%) Graduate
3 15 (13.16%) Graduate Developer
3 15 (13.16%) IT Graduate
4 10 (8.77%) Project Manager
5 8 (7.02%) Engineering Manager
6 7 (6.14%) C# Developer
6 7 (6.14%) Graduate C# Developer
6 7 (6.14%) Graduate PHP Developer
6 7 (6.14%) Graduate SQL Developer
6 7 (6.14%) PHP Developer
6 7 (6.14%) Senior Developer
6 7 (6.14%) SQL Developer
7 6 (5.26%) Consultant
7 6 (5.26%) Lead
8 5 (4.39%) Data Manager
8 5 (4.39%) IT Manager
9 4 (3.51%) Analyst
9 4 (3.51%) Network Engineer
Libraries, Frameworks & Software Standards
1 19 (16.67%) CSS
2 17 (14.91%) .NET
3 15 (13.16%) ASP.NET
3 15 (13.16%) jQuery
4 5 (4.39%) HTML
4 5 (4.39%) OAuth
4 5 (4.39%) SAML
5 3 (2.63%) Middleware
5 3 (2.63%) OpenEmbedded
5 3 (2.63%) Restlet
5 3 (2.63%) SAPUI5
5 3 (2.63%) Web Services
5 3 (2.63%) XML
5 3 (2.63%) Yocto
6 2 (1.75%) NestJS
6 2 (1.75%) OpenID
6 2 (1.75%) React
6 2 (1.75%) React Native
6 2 (1.75%) REST
6 2 (1.75%) SAP Fiori
Miscellaneous
1 10 (8.77%) Self-Motivation
2 5 (4.39%) Onboarding
3 3 (2.63%) Cloud Native
3 3 (2.63%) Greenfield Project
3 3 (2.63%) IoT
3 3 (2.63%) Mobile App
4 2 (1.75%) Cyber Threat
4 2 (1.75%) Data Protection Act
4 2 (1.75%) Distributed Systems
5 1 (0.88%) Data Centre
5 1 (0.88%) Data Structures
5 1 (0.88%) Derivative
5 1 (0.88%) Driving Licence
5 1 (0.88%) Foreign Exchange (FX)
5 1 (0.88%) Legacy Code
5 1 (0.88%) Over-the-Top Content
5 1 (0.88%) PMI
5 1 (0.88%) Product Ownership
5 1 (0.88%) Social Media
5 1 (0.88%) Video\Live Streaming
Operating Systems
1 8 (7.02%) Linux
1 8 (7.02%) Windows
2 3 (2.63%) Embedded Linux
3 2 (1.75%) Android
3 2 (1.75%) Apple iOS
4 1 (0.88%) Unix
Processes & Methodologies
1 45 (39.47%) Agile
2 35 (30.70%) Problem-Solving
3 21 (18.42%) Computer Science
4 20 (17.54%) Virtual Team Management
5 17 (14.91%) Project Management
6 16 (14.04%) OO
7 15 (13.16%) MVC
7 15 (13.16%) OOP
8 14 (12.28%) Collaborative Culture
8 14 (12.28%) Roadmaps
9 13 (11.40%) CI/CD
9 13 (11.40%) Collaborative Working
10 12 (10.53%) Mentoring
10 12 (10.53%) Project Delivery
11 10 (8.77%) Data Modelling
11 10 (8.77%) Logistics
11 10 (8.77%) Software Engineering
11 10 (8.77%) Technical Leadership
11 10 (8.77%) Test Automation
12 9 (7.89%) Budget Management
Programming Languages
1 29 (25.44%) SQL
2 20 (17.54%) C++
3 18 (15.79%) Java
4 16 (14.04%) C#
4 16 (14.04%) PHP
5 13 (11.40%) Python
6 9 (7.89%) JavaScript
7 5 (4.39%) C
8 3 (2.63%) Bash
8 3 (2.63%) PowerShell
8 3 (2.63%) TypeScript
9 1 (0.88%) ABAP
9 1 (0.88%) Go
9 1 (0.88%) Kotlin
9 1 (0.88%) Swift
9 1 (0.88%) T-SQL
Qualifications
1 35 (30.70%) Degree
2 19 (16.67%) Computer Science Degree
3 10 (8.77%) Security Cleared
4 7 (6.14%) SC Cleared
5 5 (4.39%) ACCA
5 5 (4.39%) CIMA
6 4 (3.51%) PMP
7 3 (2.63%) CIPD
7 3 (2.63%) DBS Check
7 3 (2.63%) SAP Certification
8 2 (1.75%) AAT
8 2 (1.75%) CCIE
8 2 (1.75%) Cisco Certification
9 1 (0.88%) AWS Certification
9 1 (0.88%) CCDE
9 1 (0.88%) HNC
9 1 (0.88%) Linux+ Certification
9 1 (0.88%) Network+ Certification
9 1 (0.88%) Numerate Degree
9 1 (0.88%) PMI Certification
Quality Assurance & Compliance
1 7 (6.14%) QA
2 4 (3.51%) ISO/IEC 27001
3 3 (2.63%) Accessibility
3 3 (2.63%) JTAG
4 1 (0.88%) EU AI Act
4 1 (0.88%) ISO/IEC 42001
4 1 (0.88%) NIST
4 1 (0.88%) PCI DSS
4 1 (0.88%) WCAG
System Software
1 6 (5.26%) Firmware
2 3 (2.63%) Docker
3 2 (1.75%) Active Directory
4 1 (0.88%) KVM
4 1 (0.88%) VMware Infrastructure
Systems Management
1 5 (4.39%) Ansible
1 5 (4.39%) Single Sign-On
2 4 (3.51%) Terraform
3 1 (0.88%) Kubernetes
3 1 (0.88%) Puppet
Vendors
1 9 (7.89%) SAP
2 8 (7.02%) TikTok
3 6 (5.26%) Adobe
3 6 (5.26%) Cisco
3 6 (5.26%) Databricks
3 6 (5.26%) Microsoft
4 3 (2.63%) Fortinet
4 3 (2.63%) Google
4 3 (2.63%) iManage
4 3 (2.63%) Intapp
4 3 (2.63%) MuleSoft
5 2 (1.75%) Facebook
5 2 (1.75%) Juniper
5 2 (1.75%) Xero
6 1 (0.88%) Atlassian
6 1 (0.88%) NetApp
6 1 (0.88%) Palo Alto
6 1 (0.88%) Salesforce
6 1 (0.88%) Sophos
6 1 (0.88%) VMware