SOAP Jobs with Hybrid/Remote/WFH Options

Simple Object Access Protocol (SOAP)
UK > Work from Home

The table below provides summary statistics for permanent remote or hybrid work requiring SOAP skills. It includes a benchmarking guide to the annual salaries offered in vacancies that cited SOAP over the 6 months leading up to 5 May 2025, comparing them to the same period in the previous two years.

6 months to
5 May 2025
Same period 2024 Same period 2023
Rank 304 339 295
Rank change year-on-year +35 -44 +4
Permanent jobs citing SOAP 117 276 471
As % of all permanent jobs with a WFH option 0.76% 0.82% 1.11%
As % of the Libraries, Frameworks & Software Standards category 2.90% 3.08% 3.28%
Number of salaries quoted 103 255 382
10th Percentile £41,250 £38,400 £41,067
25th Percentile £50,000 £43,750 £50,000
Median annual salary (50th Percentile) £62,500 £57,500 £62,500
Median % change year-on-year +8.70% -8.00% +13.64%
75th Percentile £72,500 £67,500 £78,382
90th Percentile £84,750 £77,500 £90,000
UK median annual salary £60,000 £57,500 £68,823
% change year-on-year +4.35% -16.45% +25.13%

All Software Libraries and Frameworks
Work from Home

SOAP falls under the Software Libraries and Frameworks category. For comparison with the information above, the following table provides summary statistics for all permanent job vacancies with remote or hybrid options requiring technical specification, industry standards, software libraries and framework skills.

Permanent vacancies with a requirement for technical specification, industry standards, software libraries and framework skills 4,036 8,949 14,351
As % of all permanent jobs with a WFH option 26.18% 26.48% 33.86%
Number of salaries quoted 3,163 7,484 10,777
10th Percentile £40,000 £38,825 £41,250
25th Percentile £51,250 £47,500 £50,854
Median annual salary (50th Percentile) £65,000 £60,000 £65,000
Median % change year-on-year +8.33% -7.69% +4.00%
75th Percentile £86,250 £78,750 £86,250
90th Percentile £115,000 £98,750 £102,500
UK median annual salary £65,000 £60,000 £67,500
% change year-on-year +8.33% -11.11% +7.89%

SOAP
Trend for Jobs with a WFH Option

Job vacancies with remote working options citing SOAP as a proportion of all IT jobs advertised.
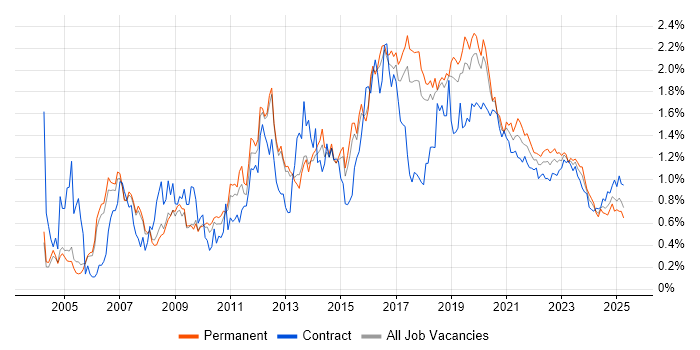
SOAP trend for jobs with Hybrid/Remote/WFH options

SOAP
Salary Trend for Jobs with a WFH Option

3-month moving average salary quoted in job vacancies with remote working options citing SOAP.

SOAP salary trend for jobs with a WFH option

SOAP
Salary Histogram for Jobs with a WFH Option

Salary distribution for jobs with remote working options citing SOAP over the 6 months to 5 May 2025.

SOAP salary histogram for jobs with a WFH option

SOAP
Co-occurring Skills and Capabilities with WFH Options by Category

The follow tables expand on the table above by listing co-occurrences grouped by category. The same employment type, locality and period is covered with up to 20 co-occurrences shown in each of the following categories:

Application Platforms
1 7 (5.98%) SharePoint
2 5 (4.27%) IIS
2 5 (4.27%) Tomcat
3 3 (2.56%) OpenEdge
4 2 (1.71%) CICS
4 2 (1.71%) Oracle Workflow
5 1 (0.85%) ColdFusion
5 1 (0.85%) Confluence
5 1 (0.85%) Mendix
Applications
1 9 (7.69%) Microsoft Office
2 2 (1.71%) Oracle Smart View
2 2 (1.71%) Spreadsheet
3 1 (0.85%) Trello
Business Applications
1 11 (9.40%) JDE OneWorld
1 11 (9.40%) NetSuite
2 10 (8.55%) Dynamics CRM
3 6 (5.13%) SAP S/4HANA
4 2 (1.71%) Oracle Assets
4 2 (1.71%) Oracle Cash Management
4 2 (1.71%) Oracle ERP
4 2 (1.71%) Oracle Financials
4 2 (1.71%) Oracle General Ledger
4 2 (1.71%) Oracle Payables
4 2 (1.71%) Oracle Receivables
5 1 (0.85%) Elite 3E
5 1 (0.85%) Remedy ITSM
Cloud Services
1 53 (45.30%) Azure
2 21 (17.95%) Power Platform
3 19 (16.24%) AWS
3 19 (16.24%) Dynamics 365
4 15 (12.82%) Azure Logic Apps
4 15 (12.82%) Power Automate
5 14 (11.97%) Azure DevOps
6 12 (10.26%) Boomi
6 12 (10.26%) Microsoft 365
7 9 (7.69%) Entra ID
7 9 (7.69%) PowerApps
8 8 (6.84%) SaaS
9 7 (5.98%) GitHub
10 6 (5.13%) Serverless
11 5 (4.27%) Microsoft Copilot
11 5 (4.27%) PaaS
12 4 (3.42%) Azure Key Vault
12 4 (3.42%) Azure Service Bus
13 3 (2.56%) Azure Event Grid
13 3 (2.56%) iPaaS
Communications & Networking
1 7 (5.98%) SSL
2 5 (4.27%) DMARC
2 5 (4.27%) HTTP
2 5 (4.27%) VPN
3 4 (3.42%) Firewall
3 4 (3.42%) HTTPS
3 4 (3.42%) LAN
3 4 (3.42%) TCP/IP
3 4 (3.42%) WAN
Database & Business Intelligence
1 26 (22.22%) SQL Server
2 16 (13.68%) OLTP
3 12 (10.26%) PostgreSQL
4 11 (9.40%) SQL Server Reporting Services
5 10 (8.55%) SQL Server Integration Services
6 9 (7.69%) Power BI
7 5 (4.27%) Relational Database
8 4 (3.42%) Azure SQL Database
9 3 (2.56%) Data Warehouse
9 3 (2.56%) MySQL
10 2 (1.71%) DB2
10 2 (1.71%) NoSQL
10 2 (1.71%) Oracle Database
10 2 (1.71%) Redis
11 1 (0.85%) Big Data
11 1 (0.85%) DynamoDB
11 1 (0.85%) Oracle BI Publisher
11 1 (0.85%) SQL Server Analysis Services
11 1 (0.85%) Tableau
Development Applications
1 15 (12.82%) Git
2 13 (11.11%) JIRA
2 13 (11.11%) Postman
3 10 (8.55%) SoapUI
4 8 (6.84%) Jenkins
5 6 (5.13%) Visual Studio
6 5 (4.27%) Selenium
7 4 (3.42%) Cucumber
7 4 (3.42%) Spinnaker
7 4 (3.42%) WiX
8 3 (2.56%) Subversion
8 3 (2.56%) Xcode
9 2 (1.71%) Atlassian Bamboo
9 2 (1.71%) JUnit
9 2 (1.71%) Maven
9 2 (1.71%) Mockito
9 2 (1.71%) REST Assured
9 2 (1.71%) SonarQube
9 2 (1.71%) Visual Studio Code
9 2 (1.71%) XCTest
General
1 40 (34.19%) Social Skills
2 27 (23.08%) Finance
3 20 (17.09%) Analytical Skills
4 9 (7.69%) Banking
5 7 (5.98%) Presentation Skills
6 6 (5.13%) Organisational Skills
7 5 (4.27%) Czech Language
7 5 (4.27%) Public Sector
8 4 (3.42%) Influencing Skills
8 4 (3.42%) Law
8 4 (3.42%) Legal
9 3 (2.56%) Documentation Skills
9 3 (2.56%) Military
10 2 (1.71%) Aerospace
10 2 (1.71%) General Ledger
10 2 (1.71%) Local Government
10 2 (1.71%) Manufacturing
11 1 (0.85%) Advertising
11 1 (0.85%) Back Office
11 1 (0.85%) Electronics
Job Titles
1 57 (48.72%) Developer
2 20 (17.09%) Senior
3 17 (14.53%) Senior Developer
4 16 (13.68%) Oracle Developer
4 16 (13.68%) Senior Oracle Developer
5 14 (11.97%) Lead
6 13 (11.11%) PL/SQL Developer
6 13 (11.11%) Senior PL/SQL Developer
6 13 (11.11%) Senior SQL Developer
6 13 (11.11%) SQL Developer
7 11 (9.40%) Analyst
7 11 (9.40%) NetSuite Developer
8 10 (8.55%) Integration Analyst
9 8 (6.84%) Dynamics 365 Developer
9 8 (6.84%) Software Engineer
10 7 (5.98%) Integration Engineer
11 6 (5.13%) Architect
12 5 (4.27%) Administrator
12 5 (4.27%) Junior
12 5 (4.27%) Lead Developer
Libraries, Frameworks & Software Standards
1 72 (61.54%) REST
2 56 (47.86%) XML
3 45 (38.46%) HTML
4 41 (35.04%) Web Services
5 30 (25.64%) JSON
6 24 (20.51%) CSS
7 22 (18.80%) .NET
8 20 (17.09%) RESTful
9 14 (11.97%) CSS3
10 13 (11.11%) Hibernate
10 13 (11.11%) jQuery
11 7 (5.98%) Middleware
11 7 (5.98%) OAuth
12 6 (5.13%) .NET Framework
12 6 (5.13%) AngularJS
12 6 (5.13%) ASP.NET
12 6 (5.13%) Swagger
13 5 (4.27%) Bootstrap
13 5 (4.27%) Entity Framework
13 5 (4.27%) LDAP
Miscellaneous
1 10 (8.55%) Enterprise Software
2 6 (5.13%) Cloud Native
3 5 (4.27%) Self-Motivation
4 4 (3.42%) Low-Code
4 4 (3.42%) Wiki
5 3 (2.56%) Distributed Systems
5 3 (2.56%) Legacy Systems
5 3 (2.56%) Mainframe
5 3 (2.56%) Management Information System
6 2 (1.71%) Greenfield Project
6 2 (1.71%) IBM Mainframe
6 2 (1.71%) Social Media
7 1 (0.85%) CMDB
7 1 (0.85%) Grid Computing
7 1 (0.85%) Mobile App
7 1 (0.85%) Team-Oriented Environment
7 1 (0.85%) Video Conferencing
Operating Systems
1 18 (15.38%) Windows
2 13 (11.11%) Linux
3 11 (9.40%) Unix
4 4 (3.42%) Mac OS
4 4 (3.42%) Windows 10
5 2 (1.71%) Android
5 2 (1.71%) zOS
6 1 (0.85%) Apple iOS
6 1 (0.85%) CentOS
6 1 (0.85%) Debian
Processes & Methodologies
1 51 (43.59%) Problem-Solving
2 35 (29.91%) Agile
3 27 (23.08%) CRM
4 22 (18.80%) DevOps
5 21 (17.95%) Software Testing
6 18 (15.38%) ERP
6 18 (15.38%) OO
7 15 (12.82%) CI/CD
7 15 (12.82%) OOP
8 14 (11.97%) Migration
9 13 (11.11%) Roadmaps
9 13 (11.11%) SDLC
10 12 (10.26%) Business Intelligence
10 12 (10.26%) Data Management
10 12 (10.26%) Event-Driven
10 12 (10.26%) Event-Driven Architecture
10 12 (10.26%) User Experience
11 11 (9.40%) Customer Service
11 11 (9.40%) Integration Patterns
11 11 (9.40%) UX Design
Programming Languages
1 81 (69.23%) SQL
2 52 (44.44%) JavaScript
3 30 (25.64%) C#
4 21 (17.95%) Java
5 17 (14.53%) PL/SQL
5 17 (14.53%) PowerShell
5 17 (14.53%) Python
6 11 (9.40%) TypeScript
7 8 (6.84%) Bash
7 8 (6.84%) T-SQL
8 5 (4.27%) VBA
9 4 (3.42%) C
9 4 (3.42%) C++
9 4 (3.42%) Jython
9 4 (3.42%) Perl
10 3 (2.56%) OpenEdge ABL
10 3 (2.56%) PHP
10 3 (2.56%) Progress 4GL
11 2 (1.71%) COBOL
11 2 (1.71%) Go
Qualifications
1 15 (12.82%) Degree
2 4 (3.42%) Azure Certification
2 4 (3.42%) SC Cleared
2 4 (3.42%) Security Cleared
3 3 (2.56%) BPSS Clearance
3 3 (2.56%) Computer Science Degree
4 2 (1.71%) CTC Cleared
4 2 (1.71%) DBS Check
4 2 (1.71%) Master's Degree
4 2 (1.71%) Microsoft Certification
4 2 (1.71%) SAP Certification
5 1 (0.85%) AWS Certification
5 1 (0.85%) ITIL Foundation Certificate
Quality Assurance & Compliance
1 16 (13.68%) Accessibility
2 10 (8.55%) ISO/IEC 27001
3 8 (6.84%) QA
4 4 (3.42%) Sarbanes-Oxley
5 3 (2.56%) GDPR
5 3 (2.56%) PMO
6 2 (1.71%) Data Quality
System Software
1 9 (7.69%) Active Directory
2 4 (3.42%) Docker
Systems Management
1 9 (7.69%) Microsoft Intune
2 5 (4.27%) Single Sign-On
3 3 (2.56%) Kubernetes
4 2 (1.71%) CA Endevor
4 2 (1.71%) MAINVIEW
5 1 (0.85%) Argo
5 1 (0.85%) HP UCMDB
5 1 (0.85%) Marathon
5 1 (0.85%) Terraform
Vendors
1 34 (29.06%) Microsoft
2 30 (25.64%) Oracle
3 14 (11.97%) Salesforce
4 12 (10.26%) Dell
5 10 (8.55%) ServiceNow
6 9 (7.69%) IBM
7 6 (5.13%) Dynatrace
7 6 (5.13%) SAP
8 4 (3.42%) VMware
9 3 (2.56%) BMC
9 3 (2.56%) Progress
10 2 (1.71%) CA Agile Central
10 2 (1.71%) MuleSoft
10 2 (1.71%) Splunk
11 1 (0.85%) Google
11 1 (0.85%) HP
11 1 (0.85%) Informatica
11 1 (0.85%) Intapp
11 1 (0.85%) Red Hat
11 1 (0.85%) Remedy