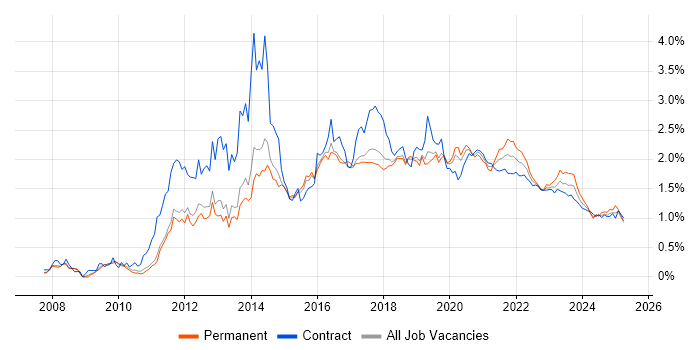
JSON Jobs with Hybrid/Remote/WFH Options

JSON
UK > Work from Home

The table below provides summary statistics for permanent remote or hybrid work requiring JSON skills. It includes a benchmarking guide to the annual salaries offered in vacancies that cited JSON over the 6 months leading up to 3 July 2025, comparing them to the same period in the previous two years.

6 months to
3 Jul 2025
Same period 2024 Same period 2023
Rank 309 287 226
Rank change year-on-year -22 -61 -13
Permanent jobs citing JSON 172 374 538
As % of all permanent jobs with a WFH option 0.84% 1.08% 1.50%
As % of the Libraries, Frameworks & Software Standards category 3.38% 4.06% 4.57%
Number of salaries quoted 142 299 405
10th Percentile £37,500 £40,000 £42,500
25th Percentile £50,000 £49,250 £51,250
Median annual salary (50th Percentile) £65,000 £60,000 £62,500
Median % change year-on-year +8.33% -4.00% +4.17%
75th Percentile £83,750 £68,750 £76,250
90th Percentile £92,775 £82,750 £88,750
UK median annual salary £63,000 £59,175 £65,000
% change year-on-year +6.46% -8.96% +8.33%

All Software Libraries and Frameworks
Work from Home

JSON falls under the Software Libraries and Frameworks category. For comparison with the information above, the following table provides summary statistics for all permanent job vacancies with remote or hybrid options requiring technical specification, industry standards, software libraries and framework skills.

Permanent vacancies with a requirement for technical specification, industry standards, software libraries and framework skills 5,091 9,208 11,774
As % of all permanent jobs with a WFH option 24.98% 26.70% 32.74%
Number of salaries quoted 2,926 7,564 9,268
10th Percentile £37,500 £38,750 £41,250
25th Percentile £51,250 £46,250 £51,104
Median annual salary (50th Percentile) £66,228 £60,000 £65,351
Median % change year-on-year +10.38% -8.19% +4.56%
75th Percentile £86,250 £81,250 £85,000
90th Percentile £115,000 £110,000 £105,000
UK median annual salary £67,500 £60,000 £67,000
% change year-on-year +12.50% -10.45% +4.76%

JSON
Trend for Jobs with a WFH Option

Job vacancies with remote working options citing JSON as a proportion of all IT jobs advertised.

JSON trend for jobs with Hybrid/Remote/WFH options

JSON
Salary Trend for Jobs with a WFH Option

3-month moving average salary quoted in job vacancies with remote working options citing JSON.

JSON salary trend for jobs with a WFH option

JSON
Salary Histogram for Jobs with a WFH Option

Salary distribution for jobs with remote working options citing JSON over the 6 months to 3 July 2025.

JSON salary histogram for jobs with a WFH option

JSON
Co-occurring Skills and Capabilities with WFH Options by Category

The follow tables expand on the table above by listing co-occurrences grouped by category. The same employment type, locality and period is covered with up to 20 co-occurrences shown in each of the following categories:

Application Platforms
1 13 (7.56%) IIS
2 9 (5.23%) Tomcat
3 7 (4.07%) Confluence
4 5 (2.91%) OpenEdge
4 5 (2.91%) SharePoint
5 4 (2.33%) CMS
6 3 (1.74%) WordPress
7 2 (1.16%) Apache Airflow
7 2 (1.16%) Oracle SOA Suite
8 1 (0.58%) Anypoint
8 1 (0.58%) Apache
8 1 (0.58%) Apache Spark
8 1 (0.58%) ColdFusion
8 1 (0.58%) Ethereum
8 1 (0.58%) Mule
8 1 (0.58%) Oracle Workflow
8 1 (0.58%) Solana
8 1 (0.58%) Umbraco
Applications
1 10 (5.81%) Microsoft Office
2 7 (4.07%) Microsoft Excel
3 5 (2.91%) Trello
4 3 (1.74%) MS Visio
5 1 (0.58%) Chatbot
Business Applications
1 12 (6.98%) NetSuite
2 11 (6.40%) Dynamics CRM
2 11 (6.40%) JDE OneWorld
3 2 (1.16%) Elite 3E
4 1 (0.58%) Shopify
Cloud Services
1 94 (54.65%) Azure
2 37 (21.51%) Azure DevOps
3 29 (16.86%) Azure Service Bus
4 27 (15.70%) Power Platform
5 26 (15.12%) Azure Cosmos DB
6 22 (12.79%) Power Automate
6 22 (12.79%) SonarCloud
7 20 (11.63%) AWS
8 17 (9.88%) GitHub
9 16 (9.30%) Serverless
10 15 (8.72%) Microsoft 365
11 14 (8.14%) Dynamics 365
12 13 (7.56%) PowerApps
13 12 (6.98%) Azure Logic Apps
13 12 (6.98%) Boomi
13 12 (6.98%) Entra ID
13 12 (6.98%) GCP
14 11 (6.40%) Microsoft Copilot
14 11 (6.40%) SaaS
15 9 (5.23%) PaaS
Communications & Networking
1 12 (6.98%) HTTP
1 12 (6.98%) SSL
2 9 (5.23%) DMARC
3 3 (1.74%) Firewall
3 3 (1.74%) TCP/IP
3 3 (1.74%) VPN
4 2 (1.16%) BGP
4 2 (1.16%) DNS
4 2 (1.16%) IPsec
4 2 (1.16%) OSPF
4 2 (1.16%) VoIP
5 1 (0.58%) Broadband
5 1 (0.58%) DHCP
5 1 (0.58%) Ethernet
5 1 (0.58%) FTP
5 1 (0.58%) LAN
5 1 (0.58%) Network Security
5 1 (0.58%) SMTP
5 1 (0.58%) WAN
5 1 (0.58%) Wireless
Database & Business Intelligence
1 41 (23.84%) SQL Server
2 22 (12.79%) Elasticsearch
3 18 (10.47%) Power BI
4 12 (6.98%) SQL Server Reporting Services
5 11 (6.40%) PostgreSQL
6 9 (5.23%) SQL Server Integration Services
7 6 (3.49%) MongoDB
7 6 (3.49%) NoSQL
7 6 (3.49%) Redis
7 6 (3.49%) Relational Database
8 5 (2.91%) Data Lake
8 5 (2.91%) Power Query
9 4 (2.33%) Azure SQL Database
9 4 (2.33%) Big Data
9 4 (2.33%) Data Warehouse
9 4 (2.33%) MySQL
9 4 (2.33%) Parquet
10 2 (1.16%) Hadoop
10 2 (1.16%) RDBMS
11 1 (0.58%) HBase
Development Applications
1 66 (38.37%) Git
2 29 (16.86%) Team Foundation Server
2 29 (16.86%) Visual Studio
3 26 (15.12%) Octopus Deploy
4 22 (12.79%) MSBuild
5 16 (9.30%) JIRA
6 14 (8.14%) Jenkins
7 9 (5.23%) Selenium
8 7 (4.07%) NUnit
8 7 (4.07%) TeamCity
9 5 (2.91%) Postman
10 4 (2.33%) Appium
10 4 (2.33%) JUnit
10 4 (2.33%) XCUITest
11 3 (1.74%) Artifactory
11 3 (1.74%) Jasmine
11 3 (1.74%) SonarQube
11 3 (1.74%) SpecFlow
11 3 (1.74%) Subversion
11 3 (1.74%) Xcode
General
1 59 (34.30%) Social Skills
2 30 (17.44%) Finance
3 25 (14.53%) Retail
4 17 (9.88%) Law
5 15 (8.72%) Analytical Skills
6 14 (8.14%) Marketing
7 10 (5.81%) Organisational Skills
7 10 (5.81%) Presentation Skills
7 10 (5.81%) Public Sector
8 9 (5.23%) Czech Language
8 9 (5.23%) Front Office
8 9 (5.23%) Games
8 9 (5.23%) iGaming
9 7 (4.07%) Banking
10 5 (2.91%) Inclusion and Diversity
11 4 (2.33%) Investment Banking
12 3 (1.74%) Documentation Skills
12 3 (1.74%) Legal
13 1 (0.58%) Health Technology
13 1 (0.58%) Police
Job Titles
1 76 (44.19%) Developer
2 27 (15.70%) Architect
3 25 (14.53%) Technical Architect
4 16 (9.30%) Senior
5 13 (7.56%) C# Developer
6 11 (6.40%) NetSuite Developer
7 10 (5.81%) .NET Developer
7 10 (5.81%) Administrator
7 10 (5.81%) Senior Developer
8 9 (5.23%) Analyst
8 9 (5.23%) IT Administrator
8 9 (5.23%) IT Support
9 8 (4.65%) C# .NET Developer
9 8 (4.65%) CRM Developer
9 8 (4.65%) Front-End Developer (Client-Side Developer)
9 8 (4.65%) Full-Stack Developer
9 8 (4.65%) JavaScript Developer
10 7 (4.07%) Lead
10 7 (4.07%) SQL Developer
11 6 (3.49%) Technical Support Manager
Libraries, Frameworks & Software Standards
1 88 (51.16%) HTML
2 84 (48.84%) XML
3 82 (47.67%) REST
4 80 (46.51%) CSS
5 59 (34.30%) .NET
6 33 (19.19%) Web Services
7 29 (16.86%) SOAP
8 28 (16.28%) ASP.NET
9 25 (14.53%) Bootstrap
10 23 (13.37%) AngularJS
11 22 (12.79%) gRPC
12 20 (11.63%) HTML5
12 20 (11.63%) jQuery
12 20 (11.63%) Node.js
13 19 (11.05%) CSS3
14 17 (9.88%) React
14 17 (9.88%) RESTful
15 12 (6.98%) .NET Framework
15 12 (6.98%) ASP.NET Web API
16 11 (6.40%) Hibernate
Miscellaneous
1 17 (9.88%) Self-Motivation
2 13 (7.56%) Product Ownership
3 12 (6.98%) Enterprise Software
4 10 (5.81%) Cloud Native
5 8 (4.65%) Mobile Games
6 7 (4.07%) Mobile App
7 6 (3.49%) BYOD
8 5 (2.91%) Distributed Systems
8 5 (2.91%) Greenfield Project
8 5 (2.91%) Linux Command Line
9 4 (2.33%) Legacy Systems
9 4 (2.33%) Social Media
10 3 (1.74%) Credit Derivative
10 3 (1.74%) Data Centre
10 3 (1.74%) Derivative
10 3 (1.74%) Equities
10 3 (1.74%) Fixed Income
10 3 (1.74%) Foreign Exchange (FX)
10 3 (1.74%) Low-Code
10 3 (1.74%) Management Information System
Operating Systems
1 22 (12.79%) Linux
2 14 (8.14%) Windows
3 10 (5.81%) Unix
4 6 (3.49%) Apple iOS
5 2 (1.16%) Android
5 2 (1.16%) Windows Server
6 1 (0.58%) CentOS
6 1 (0.58%) Debian
6 1 (0.58%) Red Hat Enterprise Linux
Processes & Methodologies
1 66 (38.37%) Agile
2 63 (36.63%) Problem-Solving
3 49 (28.49%) DevOps
4 41 (23.84%) Microservices
5 36 (20.93%) CRM
6 35 (20.35%) Code Quality
7 34 (19.77%) Test Automation
8 32 (18.60%) Design Patterns
8 32 (18.60%) MVC
9 28 (16.28%) Technical Leadership
10 27 (15.70%) API Integration
11 26 (15.12%) Event-Driven
11 26 (15.12%) Performance Optimisation
12 25 (14.53%) Event-Driven Architecture
13 24 (13.95%) Performance Testing
14 22 (12.79%) Data Encryption
14 22 (12.79%) User Experience
15 21 (12.21%) Business Intelligence
15 21 (12.21%) Unit Testing
16 20 (11.63%) CI/CD
Programming Languages
1 106 (61.63%) JavaScript
2 96 (55.81%) SQL
3 64 (37.21%) C#
4 27 (15.70%) Java
5 20 (11.63%) Python
6 19 (11.05%) PowerShell
7 18 (10.47%) TypeScript
8 9 (5.23%) VBA
9 5 (2.91%) OpenEdge ABL
9 5 (2.91%) PHP
10 4 (2.33%) PL/SQL
10 4 (2.33%) Progress 4GL
10 4 (2.33%) Shell Script
10 4 (2.33%) Swift
11 3 (1.74%) Data Analysis Expressions
11 3 (1.74%) Groovy
11 3 (1.74%) Perl
12 2 (1.16%) Go
12 2 (1.16%) T-SQL
12 2 (1.16%) VB.NET
Qualifications
1 25 (14.53%) Degree
2 14 (8.14%) Computer Science Degree
3 7 (4.07%) BPSS Clearance
4 6 (3.49%) Security Cleared
5 3 (1.74%) Cisco Certification
5 3 (1.74%) DBS Check
5 3 (1.74%) SnowPro
6 2 (1.16%) ACCA
6 2 (1.16%) Azure Certification
6 2 (1.16%) CCNP
6 2 (1.16%) ISTQB
6 2 (1.16%) Master's Degree
6 2 (1.16%) Microsoft Certification
7 1 (0.58%) CCNA
7 1 (0.58%) PhD
7 1 (0.58%) SC Cleared
7 1 (0.58%) TOGAF Certification
Quality Assurance & Compliance
1 26 (15.12%) GDPR
2 22 (12.79%) QA
3 18 (10.47%) Accessibility
4 17 (9.88%) ISO/IEC 27001
5 4 (2.33%) Data Quality
6 3 (1.74%) NCSC
6 3 (1.74%) NIST
6 3 (1.74%) SOC 2
7 1 (0.58%) ISO 13485
7 1 (0.58%) ISO 15022
7 1 (0.58%) ISO 20022
System Software
1 31 (18.02%) Docker
2 11 (6.40%) Active Directory
3 1 (0.58%) HDFS
3 1 (0.58%) Hyper-V
3 1 (0.58%) Virtual Machines
3 1 (0.58%) VMware Infrastructure
Systems Management
1 10 (5.81%) Kubernetes
2 9 (5.23%) Microsoft Intune
2 9 (5.23%) Single Sign-On
3 4 (2.33%) Ansible
3 4 (2.33%) Terraform
4 3 (1.74%) Packer
5 1 (0.58%) FortiGate
5 1 (0.58%) Grafana
Vendors
1 37 (21.51%) Microsoft
2 18 (10.47%) Oracle
3 14 (8.14%) Salesforce
4 12 (6.98%) Dell
5 10 (5.81%) IBM
6 9 (5.23%) Google
7 7 (4.07%) ServiceNow
8 6 (3.49%) Trayport
9 4 (2.33%) Atlassian
9 4 (2.33%) Databricks
10 3 (1.74%) AppDynamics
10 3 (1.74%) Cisco
10 3 (1.74%) Juniper
10 3 (1.74%) Progress
11 2 (1.16%) Cognos
11 2 (1.16%) Mercator
11 2 (1.16%) MuleSoft
11 2 (1.16%) Red Hat
11 2 (1.16%) Snow
12 1 (0.58%) Palo Alto