Jenkins Jobs with Hybrid/Remote/WFH Options

Jenkins (JenkinsCI)
UK > Work from Home

The table below provides summary statistics for permanent remote or hybrid work requiring Jenkins skills. It includes a benchmarking guide to the annual salaries offered in vacancies that cited Jenkins over the 6 months leading up to 2 May 2025, comparing them to the same period in the previous two years.

6 months to
2 May 2025
Same period 2024 Same period 2023
Rank 173 182 85
Rank change year-on-year +9 -97 -25
Permanent jobs citing Jenkins 282 614 1,660
As % of all permanent jobs with a WFH option 1.88% 1.81% 3.89%
As % of the Development Applications category 15.30% 15.77% 25.33%
Number of salaries quoted 196 493 1,177
10th Percentile £38,750 £47,250 £47,500
25th Percentile £52,500 £57,500 £57,000
Median annual salary (50th Percentile) £71,996 £75,000 £70,000
Median % change year-on-year -4.01% +7.14% -
75th Percentile £90,944 £95,000 £92,500
90th Percentile £101,876 £112,500 £105,000
UK median annual salary £70,000 £75,000 £71,500
% change year-on-year -6.67% +4.90% +2.14%

All Development Application Skills
Work from Home

Jenkins falls under the Development Applications category. For comparison with the information above, the following table provides summary statistics for all permanent job vacancies with remote or hybrid options requiring development application skills.

Permanent vacancies with a requirement for development application skills 1,843 3,894 6,553
As % of all permanent jobs with a WFH option 12.31% 11.51% 15.35%
Number of salaries quoted 1,443 3,021 4,666
10th Percentile £42,500 £37,500 £41,250
25th Percentile £51,250 £46,250 £50,000
Median annual salary (50th Percentile) £67,500 £60,000 £64,486
Median % change year-on-year +12.50% -6.96% +7.48%
75th Percentile £82,125 £75,772 £80,000
90th Percentile £102,200 £91,934 £95,000
UK median annual salary £60,000 £60,000 £65,000
% change year-on-year - -7.69% +4.00%

Jenkins
Trend for Jobs with a WFH Option

Job vacancies with remote working options citing Jenkins as a proportion of all IT jobs advertised.
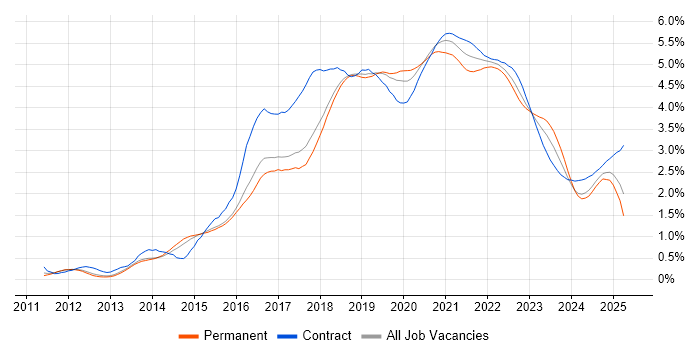
Jenkins trend for jobs with Hybrid/Remote/WFH options

Jenkins
Salary Trend for Jobs with a WFH Option

3-month moving average salary quoted in job vacancies with remote working options citing Jenkins.

Jenkins salary trend for jobs with a WFH option

Jenkins
Salary Histogram for Jobs with a WFH Option

Salary distribution for jobs with remote working options citing Jenkins over the 6 months to 2 May 2025.

Jenkins salary histogram for jobs with a WFH option

Jenkins
Co-occurring Skills and Capabilities with WFH Options by Category

The follow tables expand on the table above by listing co-occurrences grouped by category. The same employment type, locality and period is covered with up to 20 co-occurrences shown in each of the following categories:

Application Platforms
1 25 (8.87%) Confluence
2 17 (6.03%) SharePoint
3 9 (3.19%) Apache Airflow
4 5 (1.77%) Apache
5 3 (1.06%) CICS
5 3 (1.06%) OpenStack
6 2 (0.71%) Tomcat
6 2 (0.71%) WebSphere
6 2 (0.71%) WebSphere Application Server
7 1 (0.35%) Apache Spark
Applications
1 1 (0.35%) Adobe XD
1 1 (0.35%) Sketch
Business Applications
1 17 (6.03%) Sage 200
1 17 (6.03%) Sage 50
2 2 (0.71%) Oracle BPM
2 2 (0.71%) Oracle Subledger Accounting
Cloud Services
1 116 (41.13%) AWS
2 93 (32.98%) Azure
3 82 (29.08%) GCP
4 80 (28.37%) GitHub
5 33 (11.70%) Serverless
6 30 (10.64%) Azure DevOps
7 24 (8.51%) SaaS
8 22 (7.80%) Amazon EC2
8 22 (7.80%) Amazon S3
9 21 (7.45%) AWS Lambda
10 20 (7.09%) Amazon EKS
11 19 (6.74%) GitHub Actions
11 19 (6.74%) PaaS
12 16 (5.67%) Google Kubernetes Engine
13 15 (5.32%) Datadog
14 13 (4.61%) Apigee
15 11 (3.90%) AWS CloudFormation
16 8 (2.84%) Cloud Computing
17 7 (2.48%) Azure Functions
18 5 (1.77%) AWS CodeCommit
Communications & Networking
1 11 (3.90%) HTTP
1 11 (3.90%) Internet
2 8 (2.84%) VPN
3 7 (2.48%) Firewall
4 6 (2.13%) LAN
4 6 (2.13%) WAN
4 6 (2.13%) Wireless
5 5 (1.77%) TCP/IP
6 2 (0.71%) Bluetooth
6 2 (0.71%) Cisco Nexus
6 2 (0.71%) FCoE
6 2 (0.71%) Fibre Channel
6 2 (0.71%) iSCSI
6 2 (0.71%) Multicast
6 2 (0.71%) NAS
6 2 (0.71%) SAN
7 1 (0.35%) 4G
7 1 (0.35%) Diameter Protocol
7 1 (0.35%) OpenVPN
7 1 (0.35%) SCTP
Database & Business Intelligence
1 25 (8.87%) NoSQL
2 20 (7.09%) PostgreSQL
3 19 (6.74%) MongoDB
4 11 (3.90%) Relational Database
5 7 (2.48%) MySQL
5 7 (2.48%) SQL Server
6 4 (1.42%) BigQuery
6 4 (1.42%) Oracle Database
7 3 (1.06%) DB2
7 3 (1.06%) Redis
8 2 (0.71%) Amazon Redshift
8 2 (0.71%) Apache Cassandra
8 2 (0.71%) Big Data
8 2 (0.71%) ClickHouse
8 2 (0.71%) Cloud Spanner
8 2 (0.71%) CouchDB
8 2 (0.71%) Oracle Exadata
9 1 (0.35%) Amazon Athena
9 1 (0.35%) Amazon Aurora
9 1 (0.35%) Power BI
Development Applications
1 106 (37.59%) Git
2 53 (18.79%) GitLab
3 44 (15.60%) SonarQube
4 42 (14.89%) Maven
5 39 (13.83%) JUnit
6 35 (12.41%) JIRA
7 24 (8.51%) Cucumber
8 21 (7.45%) Sonatype Nexus
9 19 (6.74%) Mockito
9 19 (6.74%) Selenium
10 17 (6.03%) Visual Studio
11 15 (5.32%) IBM UrbanCode
12 14 (4.96%) IntelliJ
13 12 (4.26%) TeamCity
14 11 (3.90%) Gradle
15 9 (3.19%) Atlassian Bamboo
16 7 (2.48%) Xcode
17 6 (2.13%) AppScan
17 6 (2.13%) CircleCI
17 6 (2.13%) webpack
General
1 143 (50.71%) Finance
2 79 (28.01%) Banking
3 63 (22.34%) Social Skills
4 29 (10.28%) Telecoms
5 28 (9.93%) Analytical Skills
6 25 (8.87%) Law
7 21 (7.45%) Manufacturing
8 14 (4.96%) Games
9 10 (3.55%) Electronics
10 9 (3.19%) Inclusion and Diversity
11 8 (2.84%) Influencing Skills
12 7 (2.48%) Aerospace
12 7 (2.48%) Front Office
12 7 (2.48%) Public Sector
13 5 (1.77%) Marketing
14 4 (1.42%) Retail
15 3 (1.06%) Military
16 2 (0.71%) General Ledger
16 2 (0.71%) Investment Banking
16 2 (0.71%) Local Government
Job Titles
1 97 (34.40%) Senior
2 63 (22.34%) Developer
3 51 (18.09%) Software Engineer
4 48 (17.02%) Lead
5 41 (14.54%) DevOps Engineer
6 25 (8.87%) Senior Software Engineer
7 24 (8.51%) Cloud Engineer
7 24 (8.51%) Java Developer
8 23 (8.16%) AWS DevOps
8 23 (8.16%) Senior Developer
9 21 (7.45%) Senior DevOps
10 18 (6.38%) .NET Developer
10 18 (6.38%) Senior Cloud Engineer
11 17 (6.03%) .NET Software Developer
12 16 (5.67%) Senior Java Developer
13 14 (4.96%) AWS Developer
13 14 (4.96%) DevOps Developer
14 13 (4.61%) AWS Engineer
14 13 (4.61%) Java Pricing Developer
14 13 (4.61%) Pricing Developer
Libraries, Frameworks & Software Standards
1 41 (14.54%) Spring Boot
2 39 (13.83%) Spring
3 38 (13.48%) HTML
4 33 (11.70%) CSS
5 30 (10.64%) .NET
5 30 (10.64%) RESTful
6 28 (9.93%) REST
7 27 (9.57%) HTML5
8 23 (8.16%) Kafka
9 19 (6.74%) .NET Core
9 19 (6.74%) .NET Framework
9 19 (6.74%) Hibernate
10 18 (6.38%) Node.js
11 17 (6.03%) jQuery
11 17 (6.03%) React Native
11 17 (6.03%) Web Services
12 16 (5.67%) JSON
13 15 (5.32%) AngularJS
13 15 (5.32%) React
14 14 (4.96%) ActiveMQ
Miscellaneous
1 40 (14.18%) Management Information System
2 33 (11.70%) Public Cloud
3 20 (7.09%) Mobile App
4 17 (6.03%) Credit Derivative
4 17 (6.03%) Enterprise Software
5 16 (5.67%) Cloud Native
5 16 (5.67%) Product Ownership
6 13 (4.61%) Virtual Team
7 12 (4.26%) Mainframe
8 10 (3.55%) Legacy Systems
9 8 (2.84%) Distributed Systems
9 8 (2.84%) Foreign Exchange (FX)
9 8 (2.84%) Mobile Games
9 8 (2.84%) Online Banking
10 6 (2.13%) Device Driver
11 5 (1.77%) Derivative
12 4 (1.42%) Data Centre
12 4 (1.42%) Hybrid Cloud
12 4 (1.42%) IoT
13 3 (1.06%) Embedded Systems
Operating Systems
1 92 (32.62%) Linux
2 33 (11.70%) Windows
3 29 (10.28%) Unix
4 23 (8.16%) Android
5 18 (6.38%) Apple iOS
6 3 (1.06%) Debian
6 3 (1.06%) Windows Server
6 3 (1.06%) zOS
7 2 (0.71%) Solaris
8 1 (0.35%) Ubuntu
8 1 (0.35%) VMS
8 1 (0.35%) Windows Server 2016
Processes & Methodologies
1 188 (66.67%) CI/CD
2 168 (59.57%) DevOps
3 96 (34.04%) Software Engineering
4 91 (32.27%) Agile
5 86 (30.50%) Infrastructure as Code
6 81 (28.72%) Test Automation
7 70 (24.82%) Mentoring
8 68 (24.11%) Microservices
9 47 (16.67%) Analytics
10 44 (15.60%) TDD
11 38 (13.48%) High Availability
12 36 (12.77%) Problem-Solving
13 35 (12.41%) Containerisation
13 35 (12.41%) SDLC
14 33 (11.70%) Computer Science
15 32 (11.35%) Continuous Integration
16 30 (10.64%) Deployment Automation
17 29 (10.28%) Technical Leadership
18 27 (9.57%) Coaching
19 24 (8.51%) Cloud Security
Programming Languages
1 108 (38.30%) Python
2 94 (33.33%) Java
3 69 (24.47%) SQL
4 68 (24.11%) JavaScript
5 36 (12.77%) Bash
6 35 (12.41%) C++
7 34 (12.06%) C#
8 26 (9.22%) Go
9 21 (7.45%) Kotlin
10 15 (5.32%) C
10 15 (5.32%) Swift
11 14 (4.96%) PowerShell
12 12 (4.26%) TypeScript
13 11 (3.90%) Ruby
14 10 (3.55%) Groovy
14 10 (3.55%) Shell Script
15 8 (2.84%) JCL
15 8 (2.84%) Objective-C
16 7 (2.48%) Bicep
16 7 (2.48%) Perl
Qualifications
1 48 (17.02%) Degree
2 27 (9.57%) Security Cleared
3 13 (4.61%) Computer Science Degree
3 13 (4.61%) SC Cleared
4 6 (2.13%) AWS Certification
4 6 (2.13%) BPSS Clearance
4 6 (2.13%) Master's Degree
5 5 (1.77%) DV Cleared
6 3 (1.06%) OCP
6 3 (1.06%) Oracle Certification
7 2 (0.71%) ISTQB
7 2 (0.71%) ISTQB Foundation Certification
8 1 (0.35%) AWS Certified Solutions Architect
8 1 (0.35%) PhD
Quality Assurance & Compliance
1 21 (7.45%) QA
2 9 (3.19%) Accessibility
3 8 (2.84%) SLA
4 4 (1.42%) Sarbanes-Oxley
5 3 (1.06%) ISO/IEC 27001
6 2 (0.71%) GDPR
7 1 (0.35%) Actionable Recommendations
7 1 (0.35%) Basel III
7 1 (0.35%) Data Quality
7 1 (0.35%) HIPAA
7 1 (0.35%) IEC 62304
7 1 (0.35%) IFRS
7 1 (0.35%) IFRS 9
7 1 (0.35%) ISO 13485
7 1 (0.35%) ISO 9001
7 1 (0.35%) SOC 2
System Software
1 80 (28.37%) Docker
2 3 (1.06%) VMware Infrastructure
3 2 (0.71%) Active Directory
3 2 (0.71%) Hyper-V
3 2 (0.71%) KVM
3 2 (0.71%) NFS
3 2 (0.71%) SRDF
3 2 (0.71%) Veritas Cluster Server
3 2 (0.71%) Xen
Systems Management
1 121 (42.91%) Terraform
2 110 (39.01%) Kubernetes
3 88 (31.21%) Ansible
4 19 (6.74%) Prometheus
5 17 (6.03%) Progress Chef
5 17 (6.03%) Puppet
6 16 (5.67%) Istio
7 14 (4.96%) Grafana
8 7 (2.48%) CA Endevor
9 4 (1.42%) Packer
10 3 (1.06%) Argo
11 2 (0.71%) Active Directory Federation Services
11 2 (0.71%) Kibana
11 2 (0.71%) MAINVIEW
11 2 (0.71%) Nagios
12 1 (0.35%) CA Service Virtualization
12 1 (0.35%) Consul
12 1 (0.35%) ZABBIX
Vendors
1 27 (9.57%) IBM
2 17 (6.03%) Sage
3 16 (5.67%) Google
3 16 (5.67%) Microsoft
4 13 (4.61%) Atlassian
5 12 (4.26%) Dynatrace
6 9 (3.19%) New Relic
6 9 (3.19%) Oracle
6 9 (3.19%) Splunk
6 9 (3.19%) VMware
7 5 (1.77%) Adobe
8 4 (1.42%) IBM Sterling
8 4 (1.42%) Tealium
9 3 (1.06%) AppDynamics
9 3 (1.06%) SAP
10 2 (0.71%) BMC
10 2 (0.71%) Cisco
10 2 (0.71%) EMC
10 2 (0.71%) F5
10 2 (0.71%) NetApp