Banking Jobs with Hybrid/Remote/WFH Options

Banking
UK > Work from Home

The table below looks at the prevalence of the term Banking in remote or hybrid work. Included is a benchmarking guide to the salaries offered in vacancies that cited Banking over the 6 months leading up to 22 June 2025, comparing them to the same period in the previous two years.

6 months to
22 Jun 2025
Same period 2024 Same period 2023
Rank 10 75 26
Rank change year-on-year +65 -49 +33
Permanent jobs citing Banking 2,904 1,312 3,174
As % of all permanent jobs with a WFH option 14.70% 3.67% 8.67%
As % of the General category 18.89% 6.10% 13.26%
Number of salaries quoted 1,563 1,078 2,416
10th Percentile £23,504 £50,000 £46,350
25th Percentile £25,000 £67,500 £56,219
Median annual salary (50th Percentile) £25,087 £90,000 £72,230
Median % change year-on-year -72.13% +24.60% -1.06%
75th Percentile £85,000 £140,000 £96,857
90th Percentile £122,500 £148,750 £125,000
UK median annual salary £48,507 £87,610 £75,000
% change year-on-year -44.63% +16.81% +3.45%

All General Skills
Work from Home

Banking falls under the General Skills category. For comparison with the information above, the following table provides summary statistics for all permanent job vacancies with remote or hybrid options requiring common skills.

Permanent vacancies with a requirement for common skills 15,371 21,511 23,928
As % of all permanent jobs with a WFH option 77.82% 60.09% 65.37%
Number of salaries quoted 7,710 15,304 16,588
10th Percentile £25,087 £31,750 £36,250
25th Percentile £35,000 £41,250 £46,570
Median annual salary (50th Percentile) £55,000 £55,000 £62,500
Median % change year-on-year - -12.00% +4.17%
75th Percentile £76,250 £75,000 £82,500
90th Percentile £102,500 £96,250 £105,000
UK median annual salary £55,000 £52,500 £60,000
% change year-on-year +4.76% -12.50% -

Banking
Trend for Jobs with a WFH Option

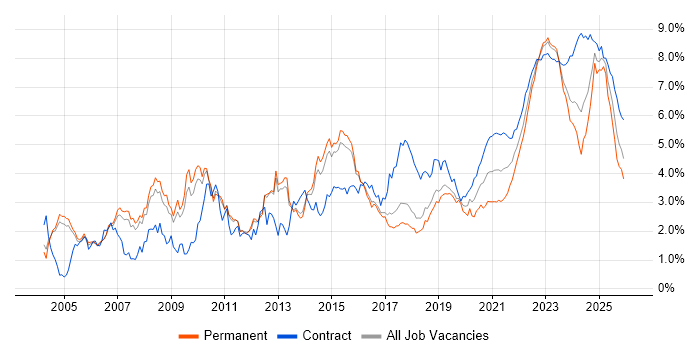
Job vacancies with remote working options citing Banking as a proportion of all IT jobs advertised.

Banking trend for jobs with Hybrid/Remote/WFH options

Banking
Salary Trend for Jobs with a WFH Option

3-month moving average salary quoted in job vacancies with remote working options citing Banking.

Banking salary trend for jobs with a WFH option

Banking
Salary Histogram for Jobs with a WFH Option

Salary distribution for jobs with remote working options citing Banking over the 6 months to 22 June 2025.

Banking salary histogram for jobs with a WFH option

Banking
Co-occurring Skills and Capabilities with WFH Options by Category

The follow tables expand on the table above by listing co-occurrences grouped by category. The same employment type, locality and period is covered with up to 20 co-occurrences shown in each of the following categories:

Application Platforms
1 187 (6.44%) Confluence
2 80 (2.75%) Apache
3 79 (2.72%) Apache Airflow
4 13 (0.45%) SAS
5 11 (0.38%) Umbraco
6 6 (0.21%) Microsoft Exchange
7 5 (0.17%) Adobe Experience Manager
8 4 (0.14%) SharePoint
9 2 (0.069%) CMS
9 2 (0.069%) NetWeaver
9 2 (0.069%) nginx
9 2 (0.069%) OpenStack
9 2 (0.069%) Tomcat
9 2 (0.069%) WebSphere
10 1 (0.034%) Apache Spark
10 1 (0.034%) CICS
10 1 (0.034%) Oracle SOA Suite
Applications
1 42 (1.45%) Microsoft Excel
2 29 (1.00%) Microsoft Office
3 15 (0.52%) Microsoft PowerPoint
4 5 (0.17%) Microsoft Project
5 4 (0.14%) Spreadsheet
6 1 (0.034%) Acrobat
6 1 (0.034%) MS Visio
Business Applications
1 6 (0.21%) Adaptiv
2 4 (0.14%) Orchestrade
3 3 (0.10%) Oracle EBS
4 1 (0.034%) Dynamics CRM
4 1 (0.034%) Oracle ERP
4 1 (0.034%) Oracle Procure-to-Pay
Cloud Services
1 422 (14.53%) AWS
2 398 (13.71%) Azure
3 364 (12.53%) GCP
4 81 (2.79%) Snowflake
5 80 (2.75%) dbt
6 37 (1.27%) Power Platform
7 22 (0.76%) GitHub
8 19 (0.65%) Amazon EKS
8 19 (0.65%) SaaS
9 18 (0.62%) Apigee
10 17 (0.59%) OpenShift
11 16 (0.55%) Google Kubernetes Engine
12 13 (0.45%) Amazon ECS
13 12 (0.41%) Amazon EC2
13 12 (0.41%) Cloud Composer
14 11 (0.38%) Dagster
14 11 (0.38%) npm
14 11 (0.38%) PaaS
15 8 (0.28%) Adobe Analytics
15 8 (0.28%) Azure DevOps
Communications & Networking
1 1,664 (57.30%) Broadband
2 20 (0.69%) TCP/IP
3 14 (0.48%) Internet
3 14 (0.48%) Network Security
4 10 (0.34%) Firewall
5 8 (0.28%) DNS
6 6 (0.21%) Multicast
6 6 (0.21%) SAN
6 6 (0.21%) VPN
7 5 (0.17%) DHCP
7 5 (0.17%) NAS
7 5 (0.17%) VSAN
8 4 (0.14%) DKIM
8 4 (0.14%) DMARC
8 4 (0.14%) DNSSEC
8 4 (0.14%) SMTP
9 3 (0.10%) LAN
9 3 (0.10%) WAN
10 2 (0.069%) SNA
10 2 (0.069%) WLAN
Database & Business Intelligence
1 275 (9.47%) SQL Server
2 79 (2.72%) Amazon Athena
2 79 (2.72%) Apache Arrow
2 79 (2.72%) Apache Iceberg
2 79 (2.72%) Dremio
3 72 (2.48%) Data Lake
4 63 (2.17%) Apache Ignite
5 53 (1.83%) Big Data
6 40 (1.38%) PostgreSQL
7 37 (1.27%) Power BI
8 35 (1.21%) NoSQL
9 30 (1.03%) BigQuery
10 21 (0.72%) Tableau
11 19 (0.65%) Data Warehouse
12 14 (0.48%) Data Hub
12 14 (0.48%) MongoDB
13 13 (0.45%) Relational Database
14 9 (0.31%) Metadata
15 8 (0.28%) Metadata Repository
15 8 (0.28%) Oracle Reports
Development Applications
1 296 (10.19%) JIRA
2 272 (9.37%) SonarQube
2 272 (9.37%) Sonatype Nexus
3 271 (9.33%) Maven
4 264 (9.09%) Cucumber
5 255 (8.78%) GitLab
6 250 (8.61%) Selenium
7 247 (8.51%) Bitbucket
8 83 (2.86%) Git
9 60 (2.07%) Jenkins
10 19 (0.65%) Oracle Forms
11 15 (0.52%) webpack
12 14 (0.48%) JUnit
13 11 (0.38%) Cypress.io
14 9 (0.31%) IBM UrbanCode
15 7 (0.24%) Visual Studio
16 5 (0.17%) NUnit
16 5 (0.17%) TeamCity
16 5 (0.17%) Xcode
16 5 (0.17%) XCTest
General
1 1,116 (38.43%) Finance
2 1,043 (35.92%) Games
3 267 (9.19%) Inclusion and Diversity
4 225 (7.75%) Social Skills
5 220 (7.58%) Investment Banking
6 143 (4.92%) Front Office
7 111 (3.82%) Retail
8 95 (3.27%) Corporate Banking
9 75 (2.58%) Analytical Skills
10 23 (0.79%) Financial Institution
11 22 (0.76%) Influencing Skills
12 20 (0.69%) Billing
13 19 (0.65%) Legal
14 15 (0.52%) Retail Banking
15 12 (0.41%) Law
15 12 (0.41%) Organisational Skills
16 7 (0.24%) Presentation Skills
17 6 (0.21%) Back Office
17 6 (0.21%) Telecoms
18 5 (0.17%) Private Banking
Job Titles
1 1,084 (37.33%) Customer Service Advisor
2 445 (15.32%) Software Engineer
3 293 (10.09%) Senior
4 140 (4.82%) Developer
5 116 (3.99%) Lead
6 109 (3.75%) Analyst
7 94 (3.24%) Senior Software Engineer
8 90 (3.10%) AWS Engineer
9 82 (2.82%) Customer Service Representative
9 82 (2.82%) Designer
9 82 (2.82%) Java Engineer
10 80 (2.75%) UX Designer
11 79 (2.72%) AWS Software Engineer
11 79 (2.72%) Senior Designer
11 79 (2.72%) Senior UX Designer
12 74 (2.55%) Architect
13 73 (2.51%) Java Software Engineer
14 63 (2.17%) Python Engineer
15 62 (2.13%) Python Software Engineer
16 60 (2.07%) Senior Java Engineer
Libraries, Frameworks & Software Standards
1 316 (10.88%) React
2 302 (10.40%) Spring Boot
3 295 (10.16%) Spring
4 277 (9.54%) Kafka
4 277 (9.54%) Redux
5 263 (9.06%) CSS
6 257 (8.85%) HTML
7 252 (8.68%) JPA
8 170 (5.85%) Hibernate
9 129 (4.44%) RESTful
10 105 (3.62%) Jest
10 105 (3.62%) REST
11 94 (3.24%) HTML5
12 93 (3.20%) CSS3
13 90 (3.10%) Sass
14 67 (2.31%) Pandas
15 65 (2.24%) gRPC
16 63 (2.17%) NumPy
16 63 (2.17%) Protocol Buffers
16 63 (2.17%) SciPy
Miscellaneous
1 346 (11.91%) Product Ownership
2 250 (8.61%) Enterprise Software
3 111 (3.82%) Foreign Exchange (FX)
4 109 (3.75%) Fixed Income
5 100 (3.44%) Derivative
6 91 (3.13%) Equities
7 81 (2.79%) Hedge funds
8 53 (1.83%) Pricing Data
9 41 (1.41%) Public Cloud
10 39 (1.34%) Cloud Native
11 38 (1.31%) Management Information System
12 25 (0.86%) Distributed Systems
13 24 (0.83%) Self-Motivation
14 22 (0.76%) Credit Risk
14 22 (0.76%) Mainframe
15 20 (0.69%) Private Cloud
16 18 (0.62%) Virtual Team
17 17 (0.59%) Market Risk
18 15 (0.52%) Algorithms
19 14 (0.48%) FPGA
Operating Systems
1 75 (2.58%) Linux
2 34 (1.17%) Unix
3 25 (0.86%) Windows
4 17 (0.59%) Android
5 14 (0.48%) Red Hat Enterprise Linux
6 11 (0.38%) Apple iOS
7 9 (0.31%) zOS
8 3 (0.10%) Windows Server
9 2 (0.069%) CentOS
9 2 (0.069%) Rocky
10 1 (0.034%) Solaris
10 1 (0.034%) Windows Server 2008
10 1 (0.034%) Windows Server 2019
Processes & Methodologies
1 1,193 (41.08%) Customer Service
2 1,169 (40.25%) Problem-Solving
3 704 (24.24%) Agile
4 568 (19.56%) Software Engineering
5 407 (14.02%) DevOps
6 380 (13.09%) CI/CD
7 375 (12.91%) Microservices
8 343 (11.81%) Test Automation
9 337 (11.60%) Containerisation
10 283 (9.75%) Full-Stack Development
11 280 (9.64%) SDLC
12 255 (8.78%) Front End Development
12 255 (8.78%) Performance Optimisation
13 248 (8.54%) User Experience
14 247 (8.51%) Continuous Improvement
15 220 (7.58%) TDD
16 213 (7.33%) Mentoring
17 169 (5.82%) Clean Code
18 168 (5.79%) Stakeholder Management
19 146 (5.03%) Analytics
Programming Languages
1 494 (17.01%) Java
2 433 (14.91%) SQL
3 406 (13.98%) JavaScript
4 221 (7.61%) Python
5 196 (6.75%) TypeScript
6 39 (1.34%) C#
7 32 (1.10%) C++
8 26 (0.90%) Go
9 24 (0.83%) Bash
10 16 (0.55%) C
11 15 (0.52%) PowerShell
12 12 (0.41%) T-SQL
13 10 (0.34%) Kotlin
13 10 (0.34%) PL/SQL
14 9 (0.31%) R
15 6 (0.21%) Groovy
15 6 (0.21%) VBA
16 5 (0.17%) Data Analysis Expressions
16 5 (0.17%) Swift
17 4 (0.14%) JCL
Qualifications
1 152 (5.23%) Degree
2 20 (0.69%) CISSP
3 19 (0.65%) Master's Degree
4 17 (0.59%) CISA
5 16 (0.55%) PMI Certification
5 16 (0.55%) PMP
6 12 (0.41%) CFA
7 10 (0.34%) CISM
8 8 (0.28%) Computer Science Degree
9 7 (0.24%) Azure Certification
9 7 (0.24%) ITIL Certification
10 6 (0.21%) Cisco Certification
11 5 (0.17%) AAT
11 5 (0.17%) Microsoft Certification
11 5 (0.17%) PhD
11 5 (0.17%) VMware Certified Professional (VCP)
12 4 (0.14%) CCIE
12 4 (0.14%) CRISC
12 4 (0.14%) RHCSA
13 3 (0.10%) DBS Check
Quality Assurance & Compliance
1 272 (9.37%) QA
2 202 (6.96%) Accessibility
3 23 (0.79%) Data Quality
4 14 (0.48%) ITGC
5 11 (0.38%) GDPR
6 10 (0.34%) NIST
7 9 (0.31%) Sarbanes-Oxley
8 8 (0.28%) PMO
9 6 (0.21%) NIST 800
10 5 (0.17%) GRC
10 5 (0.17%) IFRS
10 5 (0.17%) IFRS 9
10 5 (0.17%) PCI DSS
11 4 (0.14%) Basel II
11 4 (0.14%) Basel III
11 4 (0.14%) Dodd-Frank
11 4 (0.14%) ISO/IEC 27001
11 4 (0.14%) SLA
11 4 (0.14%) SOC 1
11 4 (0.14%) SOC 2
System Software
1 363 (12.50%) Docker
2 13 (0.45%) Virtual Machines
3 5 (0.17%) VMware NSX
4 4 (0.14%) Firmware
5 3 (0.10%) VMware Infrastructure
6 2 (0.069%) VMware ESXi
7 1 (0.034%) Hyper-V
Systems Management
1 369 (12.71%) Kubernetes
2 59 (2.03%) Terraform
3 22 (0.76%) Istio
4 19 (0.65%) Ansible
5 11 (0.38%) Single Sign-On
6 9 (0.31%) Grafana
6 9 (0.31%) Nagios
6 9 (0.31%) Prometheus
7 8 (0.28%) Progress Chef
8 4 (0.14%) RSA Archer
9 3 (0.10%) Argo
9 3 (0.10%) ITRS Geneos
10 2 (0.069%) Red Hat Satellite
10 2 (0.069%) Tivoli NetView
11 1 (0.034%) Avamar
11 1 (0.034%) CA Endevor
11 1 (0.034%) CA Service Virtualization
11 1 (0.034%) NetBackup
11 1 (0.034%) Tivoli Storage Manager
Vendors
1 1,664 (57.30%) BT
2 249 (8.57%) Solace
3 80 (2.75%) Microsoft
4 69 (2.38%) Google
5 42 (1.45%) Oracle
6 28 (0.96%) IBM
7 27 (0.93%) Sun
8 15 (0.52%) ServiceNow
9 14 (0.48%) Adobe
9 14 (0.48%) Databricks
10 12 (0.41%) Murex
11 11 (0.38%) VMware
12 10 (0.34%) Red Hat
13 9 (0.31%) Cisco
14 8 (0.28%) SolarWinds
15 7 (0.24%) Confluent
15 7 (0.24%) Dynatrace
16 6 (0.21%) Apple
16 6 (0.21%) FIS
16 6 (0.21%) Splunk