Distributed Systems Jobs with Work from Home Options

Distributed Systems
UK > Work from Home

The table below looks at the prevalence of the term Distributed Systems in remote or hybrid work. Included is a benchmarking guide to the salaries offered in vacancies that cited Distributed Systems over the 6 months leading up to 26 July 2024, comparing them to the same period in the previous two years.

6 months to
26 Jul 2024
Same period 2023 Same period 2022
Rank 396 358 198
Rank change year-on-year -38 -160 +32
Permanent jobs citing Distributed Systems 140 238 1,655
As % of all permanent jobs with a WFH option 0.50% 0.73% 2.11%
As % of the Miscellaneous category 1.46% 1.87% 4.52%
Number of salaries quoted 100 190 435
10th Percentile £56,250 £59,450 £55,000
25th Percentile £63,250 £67,500 £67,500
Median annual salary (50th Percentile) £82,500 £85,000 £80,000
Median % change year-on-year -2.94% +6.25% +6.67%
75th Percentile £122,500 £105,000 £100,000
90th Percentile £182,500 £117,750 £115,000
UK median annual salary £80,000 £87,500 £82,500
% change year-on-year -8.57% +6.06% +10.00%

All Generic Skills
Work from Home

Distributed Systems falls under the General and Transferable Skills category. For comparison with the information above, the following table provides summary statistics for all permanent job vacancies with remote or hybrid options requiring generic IT skills.

Permanent vacancies with a requirement for generic IT skills 9,605 12,729 36,632
As % of all permanent jobs with a WFH option 34.38% 38.79% 46.65%
Number of salaries quoted 6,855 9,924 18,426
10th Percentile £33,500 £40,000 £37,500
25th Percentile £45,000 £50,000 £47,500
Median annual salary (50th Percentile) £60,000 £65,000 £65,000
Median % change year-on-year -7.69% - +8.33%
75th Percentile £83,750 £85,000 £85,000
90th Percentile £117,500 £107,500 £100,000
UK median annual salary £55,000 £64,000 £62,500
% change year-on-year -14.06% +2.40% +4.17%

Distributed Systems
Trend for Jobs with a WFH Option

Job vacancies with a work from home option citing Distributed Systems as a proportion of all IT jobs advertised.
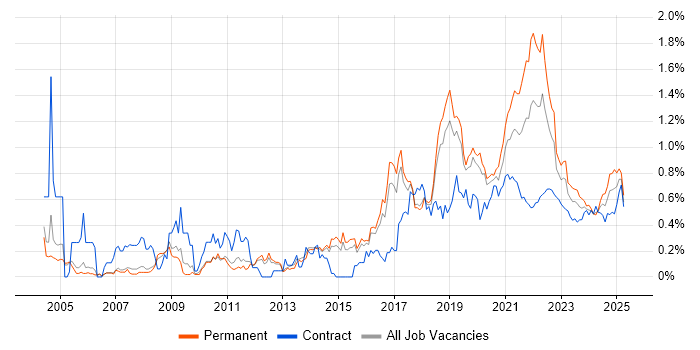
Distributed Systems trend for jobs with a WFH option

Distributed Systems
Salary Trend for Jobs with a WFH Option

3-month moving average salary quoted in job vacancies with a work from home option citing Distributed Systems.

Distributed Systems salary trend for jobs with a WFH option

Distributed Systems
Salary Histogram for Jobs with a WFH Option

Salary distribution for jobs with a work from home option citing Distributed Systems over the 6 months to 26 July 2024.

Distributed Systems salary histogram for jobs with a WFH option

Distributed Systems
Co-occurring Skills and Capabilities with WFH Options by Category

The follow tables expand on the table above by listing co-occurrences grouped by category. The same employment type, locality and period is covered with up to 20 co-occurrences shown in each of the following categories:

Application Platforms
1 10 (7.14%) Apache Spark
2 6 (4.29%) OpenStack
3 4 (2.86%) Apache
4 3 (2.14%) Apache Solr
4 3 (2.14%) Confluence
4 3 (2.14%) Ethereum
4 3 (2.14%) Hyperledger
4 3 (2.14%) JBoss
4 3 (2.14%) nginx
4 3 (2.14%) Oracle Workflow
5 2 (1.43%) Jupyter
5 2 (1.43%) MQSeries
5 2 (1.43%) Red Hat Fuse
6 1 (0.71%) Hedera
Applications
1 1 (0.71%) Simulink
Business Applications
1 2 (1.43%) Salesforce CRM
1 2 (1.43%) SAP S/4HANA
2 1 (0.71%) Endur
Cloud Services
1 55 (39.29%) AWS
2 34 (24.29%) Serverless
3 33 (23.57%) Azure
4 23 (16.43%) AWS Lambda
4 23 (16.43%) GCP
5 15 (10.71%) Amazon Kinesis
5 15 (10.71%) Amazon SQS
6 11 (7.86%) Amazon EKS
7 9 (6.43%) Amazon ECS
7 9 (6.43%) Azure DevOps
7 9 (6.43%) SaaS
8 5 (3.57%) Entra ID
9 4 (2.86%) Amazon EC2
9 4 (2.86%) Amazon S3
9 4 (2.86%) AWS CloudFormation
9 4 (2.86%) Azure Monitor
10 3 (2.14%) Cloud Computing
10 3 (2.14%) GitHub
10 3 (2.14%) Google Workspace
10 3 (2.14%) Virtual Private Cloud
Communications & Networking
1 12 (8.57%) Network Security
2 6 (4.29%) HTTP
3 3 (2.14%) BGP
3 3 (2.14%) TCP/IP
3 3 (2.14%) VLAN
3 3 (2.14%) VPN
4 1 (0.71%) DNS
Database & Business Intelligence
1 18 (12.86%) DynamoDB
2 17 (12.14%) PostgreSQL
3 14 (10.00%) BigQuery
4 11 (7.86%) Big Data
5 10 (7.14%) Redis
6 9 (6.43%) NoSQL
7 7 (5.00%) MySQL
8 6 (4.29%) ClickHouse
8 6 (4.29%) Relational Database
9 5 (3.57%) Data Lake
9 5 (3.57%) Data Warehouse
10 4 (2.86%) Amazon Aurora
10 4 (2.86%) Apache Cassandra
10 4 (2.86%) RDBMS
11 2 (1.43%) Amazon RDS
11 2 (1.43%) Apache Pinot
11 2 (1.43%) Elasticsearch
11 2 (1.43%) Event Store
11 2 (1.43%) Flink
11 2 (1.43%) Presto
Development Applications
1 24 (17.14%) Git
2 23 (16.43%) Jenkins
3 4 (2.86%) GitLab
3 4 (2.86%) JUnit
4 3 (2.14%) IntelliJ
4 3 (2.14%) JIRA
5 2 (1.43%) Bitbucket
5 2 (1.43%) MLflow
6 1 (0.71%) Cucumber
6 1 (0.71%) Gradle
6 1 (0.71%) Hardhat
6 1 (0.71%) JMeter
6 1 (0.71%) Maven
6 1 (0.71%) Mockito
General
1 32 (22.86%) Social Skills
2 30 (21.43%) Inclusion and Diversity
3 22 (15.71%) Finance
3 22 (15.71%) Retail
4 16 (11.43%) Banking
5 14 (10.00%) Public Sector
6 12 (8.57%) Games
7 11 (7.86%) Law
8 8 (5.71%) Legal
9 7 (5.00%) Analytical Skills
10 6 (4.29%) Advertising
11 4 (2.86%) Back Office
12 3 (2.14%) Financial Institution
12 3 (2.14%) Tech for Good
13 2 (1.43%) Front Office
13 2 (1.43%) Pharmaceutical
14 1 (0.71%) Aerospace
14 1 (0.71%) Automotive
14 1 (0.71%) Manufacturing
Job Titles
1 42 (30.00%) Senior
2 39 (27.86%) Software Engineer
3 31 (22.14%) Developer
4 28 (20.00%) Lead
5 25 (17.86%) Senior Software Engineer
6 16 (11.43%) Cloud Engineer
7 14 (10.00%) Java Developer
8 12 (8.57%) C Software Engineer
8 12 (8.57%) C/C++ Software Engineer
8 12 (8.57%) C++ Software Engineer
9 11 (7.86%) GCP Engineer
10 10 (7.14%) Architect
10 10 (7.14%) Lead Developer
10 10 (7.14%) Platform Engineer
10 10 (7.14%) Senior C Software Engineer
10 10 (7.14%) Senior C++ Software Engineer
10 10 (7.14%) Technical Leader
11 9 (6.43%) Cloud Platform Engineer
12 8 (5.71%) Data Engineer
13 7 (5.00%) SC Cleared Java Developer
Libraries, Frameworks & Software Standards
1 21 (15.00%) Kafka
2 18 (12.86%) Spring
3 15 (10.71%) RESTful
4 14 (10.00%) Node.js
4 14 (10.00%) React
4 14 (10.00%) Spring Boot
4 14 (10.00%) Web Services
5 11 (7.86%) AngularJS
6 8 (5.71%) REST
7 7 (5.00%) DPDK
8 6 (4.29%) Apache Camel
8 6 (4.29%) Elastic Stack
8 6 (4.29%) JSON
8 6 (4.29%) Loki
9 5 (3.57%) Hibernate
10 4 (2.86%) CSS
10 4 (2.86%) HTML
10 4 (2.86%) SAML
10 4 (2.86%) SOAP
10 4 (2.86%) XML
Miscellaneous
1 13 (9.29%) Data Centre
2 11 (7.86%) Algorithms
2 11 (7.86%) Blog
2 11 (7.86%) Cloud Native
3 7 (5.00%) Blockchain
3 7 (5.00%) Data Structures
4 6 (4.29%) Distributed Architecture
4 6 (4.29%) Hybrid Cloud
5 4 (2.86%) Driving Licence
5 4 (2.86%) Greenfield Project
5 4 (2.86%) Linux Command Line
6 3 (2.14%) Analytical Mindset
6 3 (2.14%) Embedded Systems
7 2 (1.43%) Device Driver
7 2 (1.43%) Distributed Applications
7 2 (1.43%) Enterprise Software
7 2 (1.43%) Fixed Income
7 2 (1.43%) Hedge funds
7 2 (1.43%) Legacy Systems
7 2 (1.43%) Robotics
Operating Systems
1 31 (22.14%) Linux
2 6 (4.29%) Windows
3 4 (2.86%) Red Hat Enterprise Linux
4 2 (1.43%) Windows 10
Processes & Methodologies
1 65 (46.43%) Software Engineering
2 50 (35.71%) Agile
3 48 (34.29%) DevOps
3 48 (34.29%) Microservices
4 33 (23.57%) Computer Science
5 30 (21.43%) CI/CD
6 25 (17.86%) Problem-Solving
7 22 (15.71%) Machine Learning
8 21 (15.00%) Infrastructure as Code
9 20 (14.29%) Event-Driven
10 18 (12.86%) Event-Driven Architecture
10 18 (12.86%) Full Stack Development
11 17 (12.14%) Site Reliability Engineering
12 16 (11.43%) Design Patterns
12 16 (11.43%) Mentoring
12 16 (11.43%) Unit Testing
13 15 (10.71%) SDLC
14 14 (10.00%) Scrum
14 14 (10.00%) TDD
15 13 (9.29%) ETL
Programming Languages
1 58 (41.43%) Java
2 53 (37.86%) Python
3 31 (22.14%) Go
4 30 (21.43%) C++
5 29 (20.71%) SQL
6 24 (17.14%) JavaScript
7 19 (13.57%) C
8 16 (11.43%) TypeScript
9 12 (8.57%) C#
10 9 (6.43%) Scala
11 8 (5.71%) PowerShell
12 7 (5.00%) Rust
13 4 (2.86%) Bash
13 4 (2.86%) Solidity
14 3 (2.14%) Kotlin
14 3 (2.14%) Ruby
15 1 (0.71%) Embedded C
15 1 (0.71%) MATLAB
Qualifications
1 34 (24.29%) Degree
2 19 (13.57%) Computer Science Degree
3 10 (7.14%) Security Cleared
4 9 (6.43%) SC Cleared
5 6 (4.29%) Azure Certification
6 5 (3.57%) Master's Degree
7 3 (2.14%) AWS Certification
7 3 (2.14%) CISSP
7 3 (2.14%) GIAC
7 3 (2.14%) PhD
8 2 (1.43%) CISM
8 2 (1.43%) Microsoft Certification
8 2 (1.43%) SANS
9 1 (0.71%) DBS Check
Quality Assurance & Compliance
1 13 (9.29%) PCI DSS
2 7 (5.00%) SOC 2
3 6 (4.29%) GDPR
3 6 (4.29%) HIPAA
4 3 (2.14%) ISO/IEC 27001
4 3 (2.14%) NIST
5 2 (1.43%) California Consumer Privacy Act
5 2 (1.43%) COBIT
5 2 (1.43%) Cyber Essentials
5 2 (1.43%) Data Quality
5 2 (1.43%) Web Application Security Consortium
6 1 (0.71%) Accessibility
System Software
1 31 (22.14%) Docker
2 6 (4.29%) Apache ZooKeeper
2 6 (4.29%) Varnish
3 4 (2.86%) Hyper-V
3 4 (2.86%) Virtual Machines
4 3 (2.14%) Active Directory
5 2 (1.43%) Firmware
Systems Management
1 41 (29.29%) Kubernetes
2 21 (15.00%) Ansible
3 20 (14.29%) Terraform
4 8 (5.71%) Grafana
5 6 (4.29%) Single Sign-On
6 4 (2.86%) Progress Chef
7 3 (2.14%) NetIQ Identity Manager
8 2 (1.43%) Argo
8 2 (1.43%) Computer Emergency Response Teams
8 2 (1.43%) Puppet
9 1 (0.71%) Kibana
9 1 (0.71%) Prometheus
Vendors
1 23 (16.43%) Google
2 12 (8.57%) Microsoft
3 6 (4.29%) Apple
3 6 (4.29%) Databricks
3 6 (4.29%) WSO2
4 5 (3.57%) Oracle
5 3 (2.14%) ForgeRock
5 3 (2.14%) NetIQ
5 3 (2.14%) Solace
6 2 (1.43%) Atlassian
6 2 (1.43%) CrowdStrike
6 2 (1.43%) NVIDIA
6 2 (1.43%) Sage
6 2 (1.43%) Salesforce
6 2 (1.43%) SAP
6 2 (1.43%) TIBCO
7 1 (0.71%) Foundry
7 1 (0.71%) Informatica
7 1 (0.71%) Red Hat
7 1 (0.71%) Tradeweb